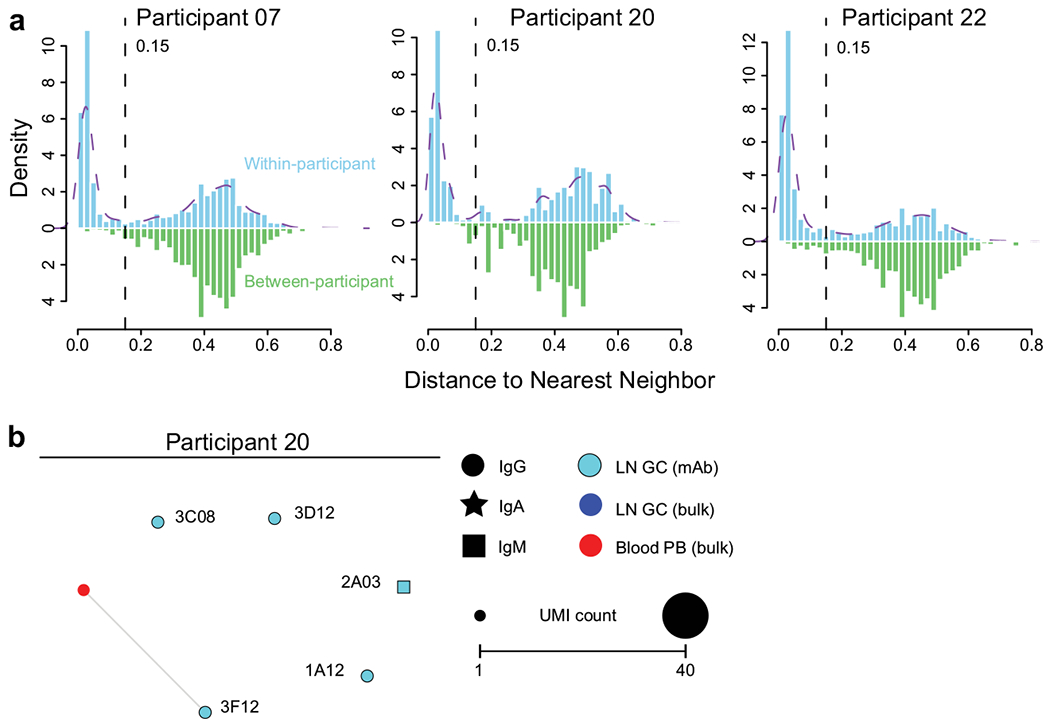
Extended Data Fig. 3|. Clonal analysis of germinal centre response to SARS-CoV-2 immunization.

a, Distance-to-nearest-neighbour plots for choosing a distance threshold for inferring clones via hierarchical clustering. After partitioning sequences based on common V and J genes and CDR3 length, the nucleotide Hamming distance of a CDR3 to its nearest nonidentical neighbour from the same participant within its partition was calculated and normalized by CDR3 length (blue histogram). For reference, the distance to the nearest nonidentical neighbour from other participants was calculated (green histogram). A clustering threshold of 0.15 (dashed black line) was chosen via manual inspection and kernel density estimate (dashed purple line) to separate the two modes of the within-participant distance distribution representing, respectively, sequences that were probably clonally related and unrelated. b, Clonal relationship of sequences from S-binding germinal centre-derived monoclonal antibodies (cyan) to sequences from bulk repertoire analysis of plasmablasts sorted from PBMCs (red) and germinal centre B cells (blue) 4 weeks after immunization. Each clone is visualized as a network in which each node represents a sequence and sequences are linked as a minimum spanning tree of the network. Symbol shape indicates sequence isotype: IgG (circle), IgA (star) and IgM (square); symbol size corresponds to sequence count.
