
Figure 3.
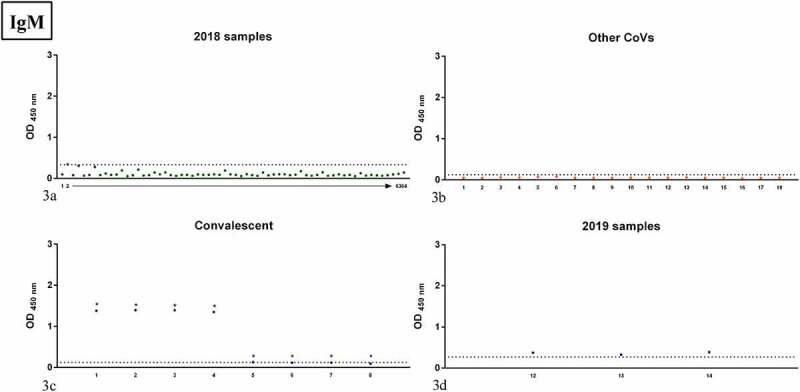
OD values of the samples tested by IgM RBD ELISA; panel 3a: samples collected in 2018 in the Apulia region (2018 samples); panel 3b: human samples positive to other human CoVs (Other CoVs); panel 3c: samples from COVID-19 convalescent patients (Convalescent); panel 3d: samples collected in 2019 in the Apulia region (2019 samples). Dots indicate individual serum samples, dashed lines indicate the OD value of the cutoff. For 2018 samples, arrow indicates consecutive numbering from sample 1 to sample 64.
* indicates samples positive to VN assay.