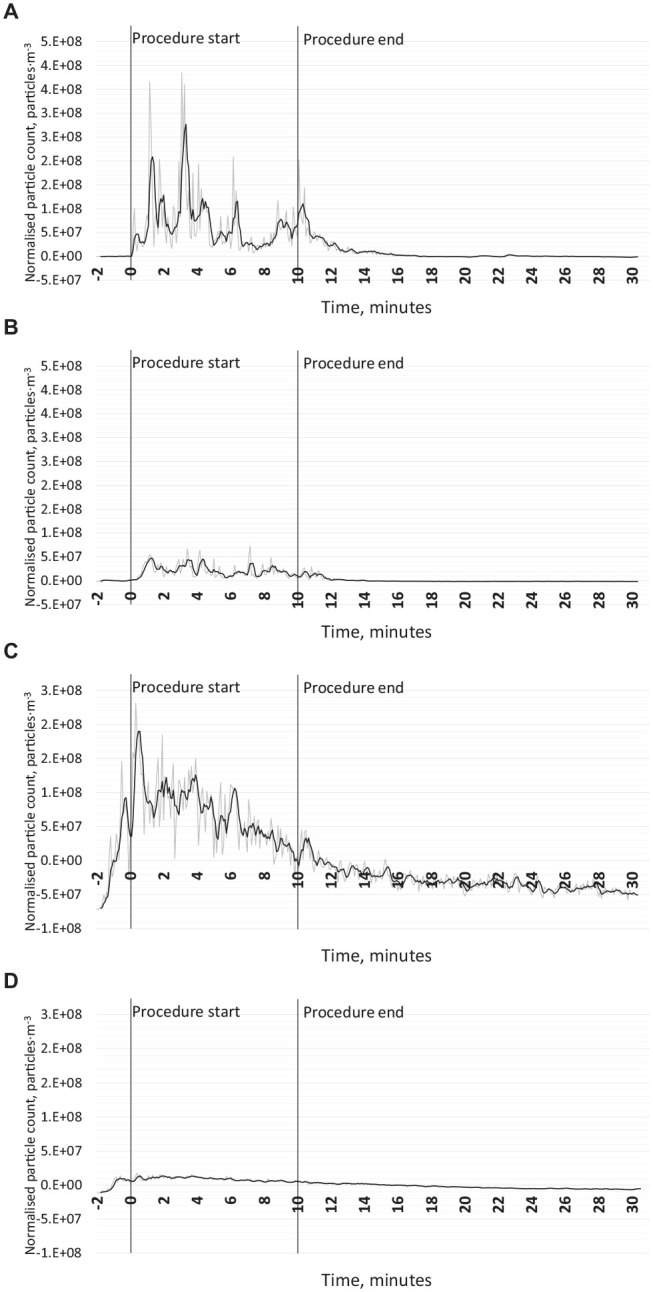
Figure 2.

Suspended droplets measured using an optical particle counter at the 0.5-m location. Illustrative data are given in this figure from 1 repetition of each experiment; data from all repetitions are available in the Appendix, as well as for 2 m and negative controls. The gray line represents the raw values, and the black line represents a 4-period moving average. (A) Positive control with suction (no local exhaust ventilation [LEV]) using the air-turbine handpiece in the open-plan setting. (B) Air-turbine with suction and LEV in the open-plan setting. (C) Positive control (no LEV or suction) using the ultrasonic scaler in the single-surgery setting. (D) Ultrasonic scaler with LEV only in the single-surgery setting.
