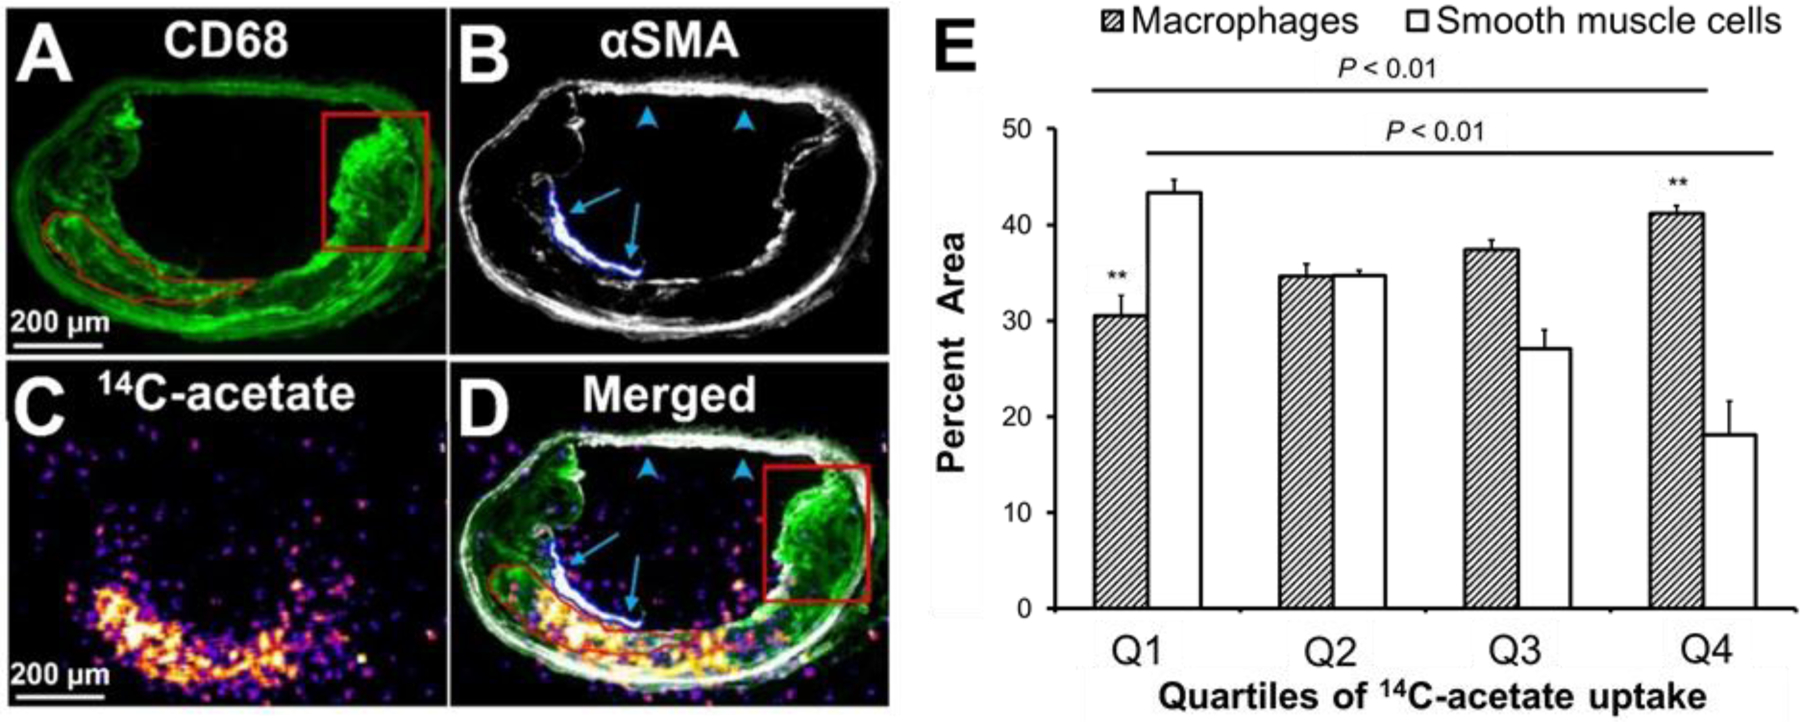
Figure 2: Colocalization of 14C-acetate uptake and macrophage-rich regions of atherosclerotic plaques.

Combine micro-autoradiography and immunofluorescent staining for CD68 (macrophage marker) and αSMA (smooth muscle cell marker) (A–D) demonstrates that areas of focal uptake of 14C-acetate primarily correspond to macrophage-rich regions of murine brachiocephalic artery atherosclerotic plaques. Of note, 14C-acetate uptake within the macrophage-rich regions of plaques was heterogeneous. Some macrophage-rich regions demonstrated high 14C-acetate uptake (marked by the red oval shape in A and D), while other regions had low uptake (marked by the red box in A and D). Smooth muscle cells both within the plaque (blue arrows in B and D) and normal regions of artery (blue arrowheads in B and D) had relatively low 14C-acetate uptake. Quantification of CD68+ and αSMA+ areas in vessel wall regions with increasing quartiles of 14C-acetate uptake (E) confirms that macrophages are the most abundant cells in regions with higher 14C-acetate uptake, while smooth muscle cells comprise the most abundant cells in regions with lower 14C-acetate uptake (N = 3 mice, 2–3 tissue sections per each mouse). ** indicates P < 0.01 for within quartile comparison of abundance of macrophages and VSMCs; P values above the brackets indicates between quartiles comparisons of the abundance of macrophages and VSMCs.
