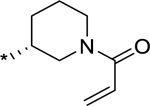
Table 3.
Binding affinity and cell growth inhibition of menin inhibitors 19–26a

| ||||
|---|---|---|---|---|
|
| ||||
| Compd. | R3 | Binding affinity to menin (IC50 (nM)) | Cell growth inhibition (IC50 (nM)) |
|
| MV4;11 | MOLM13 | |||
|
| ||||
| 19 |

|
2.7±0.5 | 2.3 ± 0.7 | 49.7 ± 7.2 |
| 20 |

|
2.8±0.3 | 112 ± 33 | 402 ± 246 |
| 21 |

|
3.8 ± 0.5 | 156 ± 30 | 594 ± 195 |
| 22 |

|
3.0 ± 0.4 | 77 ± 15 | 196 ± 44 |
| 23 |

|
3.7 ± 0.3 | 74 ± 24 | 188 ± 8 |
| 24 (M-1121) |

|
2.7 ± 0.1 | 10.3 ± 2.9 | 51.5 ± 13.5 |
| 25 |

|
4.6 ± 1.7 | 436 ± 89 | 504 ± 42 |
| 26 |

|
4.2 ± 0.7 | 289 ± 82 | 630 ± 192 |
IC50 values are average of three independent experiments.
