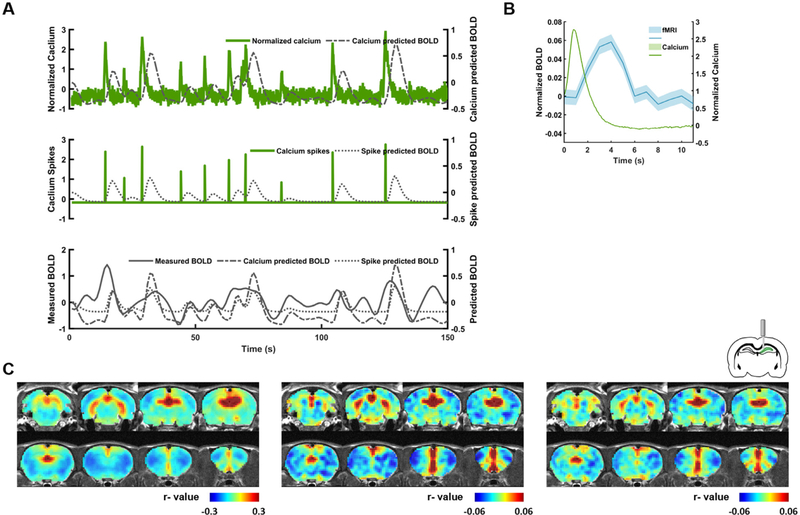
Fig. 4.
Correlation between calcium and BOLD signals at the resting state. (A) Representative (top) calcium, (middle) calcium spike, and (bottom) BOLD signals measured in the dHP at the resting state. (B) Averaged calcium (green) and BOLD (blue) signals across all spontaneous calcium peaks identified. Shaded area: SEM. (C) dHP RSFC maps generated using (left) acquired dHP BOLD signal, (middle) calcium-predicted BOLD signal, and (right) spike train-predicted BOLD signal. Statistical results are shown in Fig. S3.

