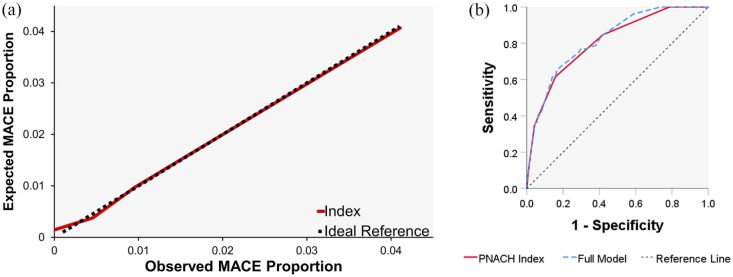
Figure 1.
Receiver operated curve (ROC) for the full regression model and (b) the final PN-A4CH index versus the reference line, and (a) the observed versus expected proportions of postoperative major adverse cardiovascular events (MACE) versus to the ideal 45° line; indicating calibration of the final simplified PN-A4CH index.

