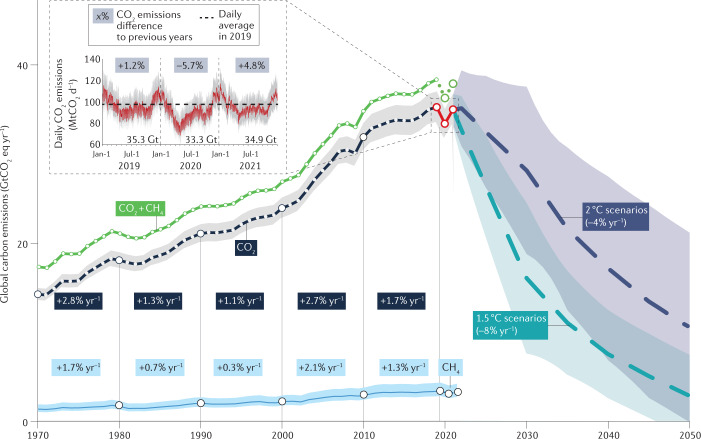
Fig. 1. Global CO2 and CH4 emission trends.
Temporal evolution of historical CO2 emissions5 (navy; including emissions from fossil fuel combustion and the process of cement production), near-real-time CO2 emissions1,3 (red), projected CO2 emission mitigation pathways10 (dark blue and aqua), and historical fossil CH4 emissions4] (light blue; 1970–2018 data from EDGARv6.0, scaled to 2021 with IEA data). Solid/dashed lines and shading represent the median and range, respectively. The inset depicts daily near-real-time CO2 data over 2019 to 2021, and the corresponding year-on-year changes in annual CO2 emissions. Current emission trends will use up the allowed future emissions for limiting anthropogenic warming to 1.5 °C (the remaining carbon budgets) within 10 years.

