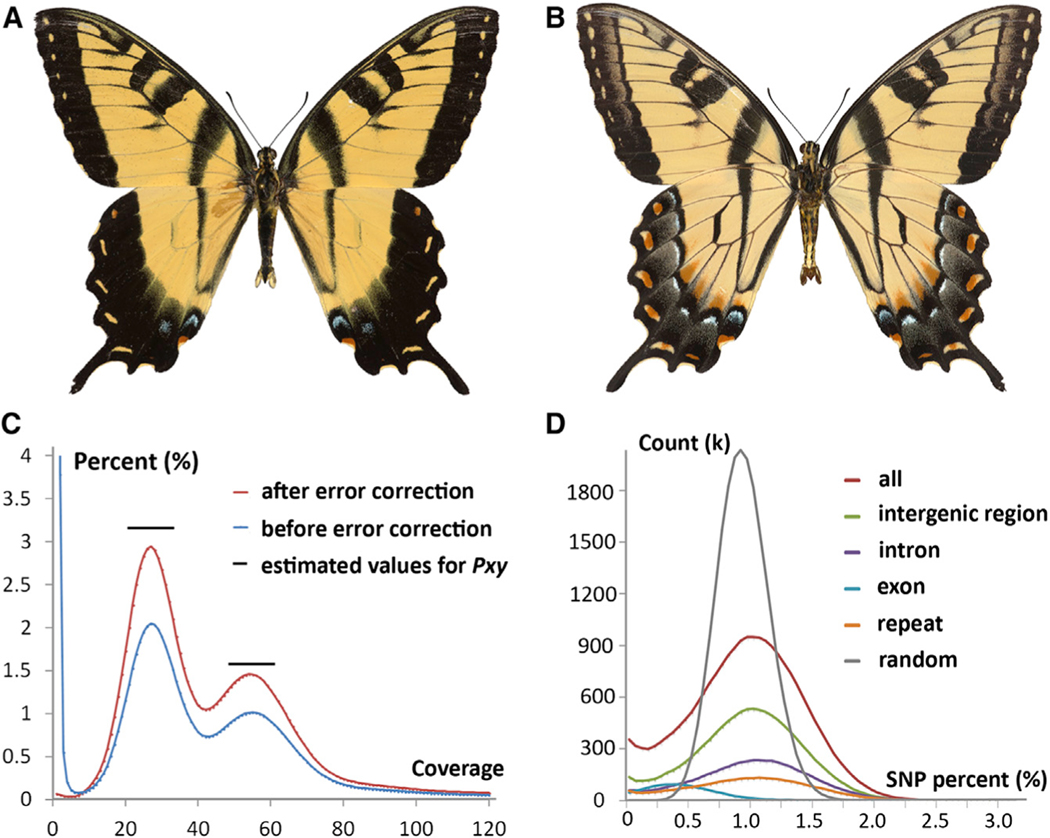
Figure 1. The Pgl Genome Is Highly Heterozygous.
(A and B) (A) Dorsal and (B) ventral aspects of the sequenced Pgl specimen that was preserved after tissue sampling.
(C) Histogram of 17-mer frequency in all the sequence reads before (blue curve) and after (red curve) error correction, which corrected the sequencing errors but not the heterozygosity problem. The peak on the left (about 30) represents frequency distribution of 17-mers from heterozygous regions, and the peak on the right (about 60) is for homozygous regions. The relative height of the two peaks is an indicator for heterozygosity level. The black lines indicate the height of the two peaks (heterozygous peak and homozygous peak) in a similar graph for Pxy (estimated from Figure S3 in You et al., 2013).
(D) Percentage of SNPs in 1,000-bp overlapping windows.

