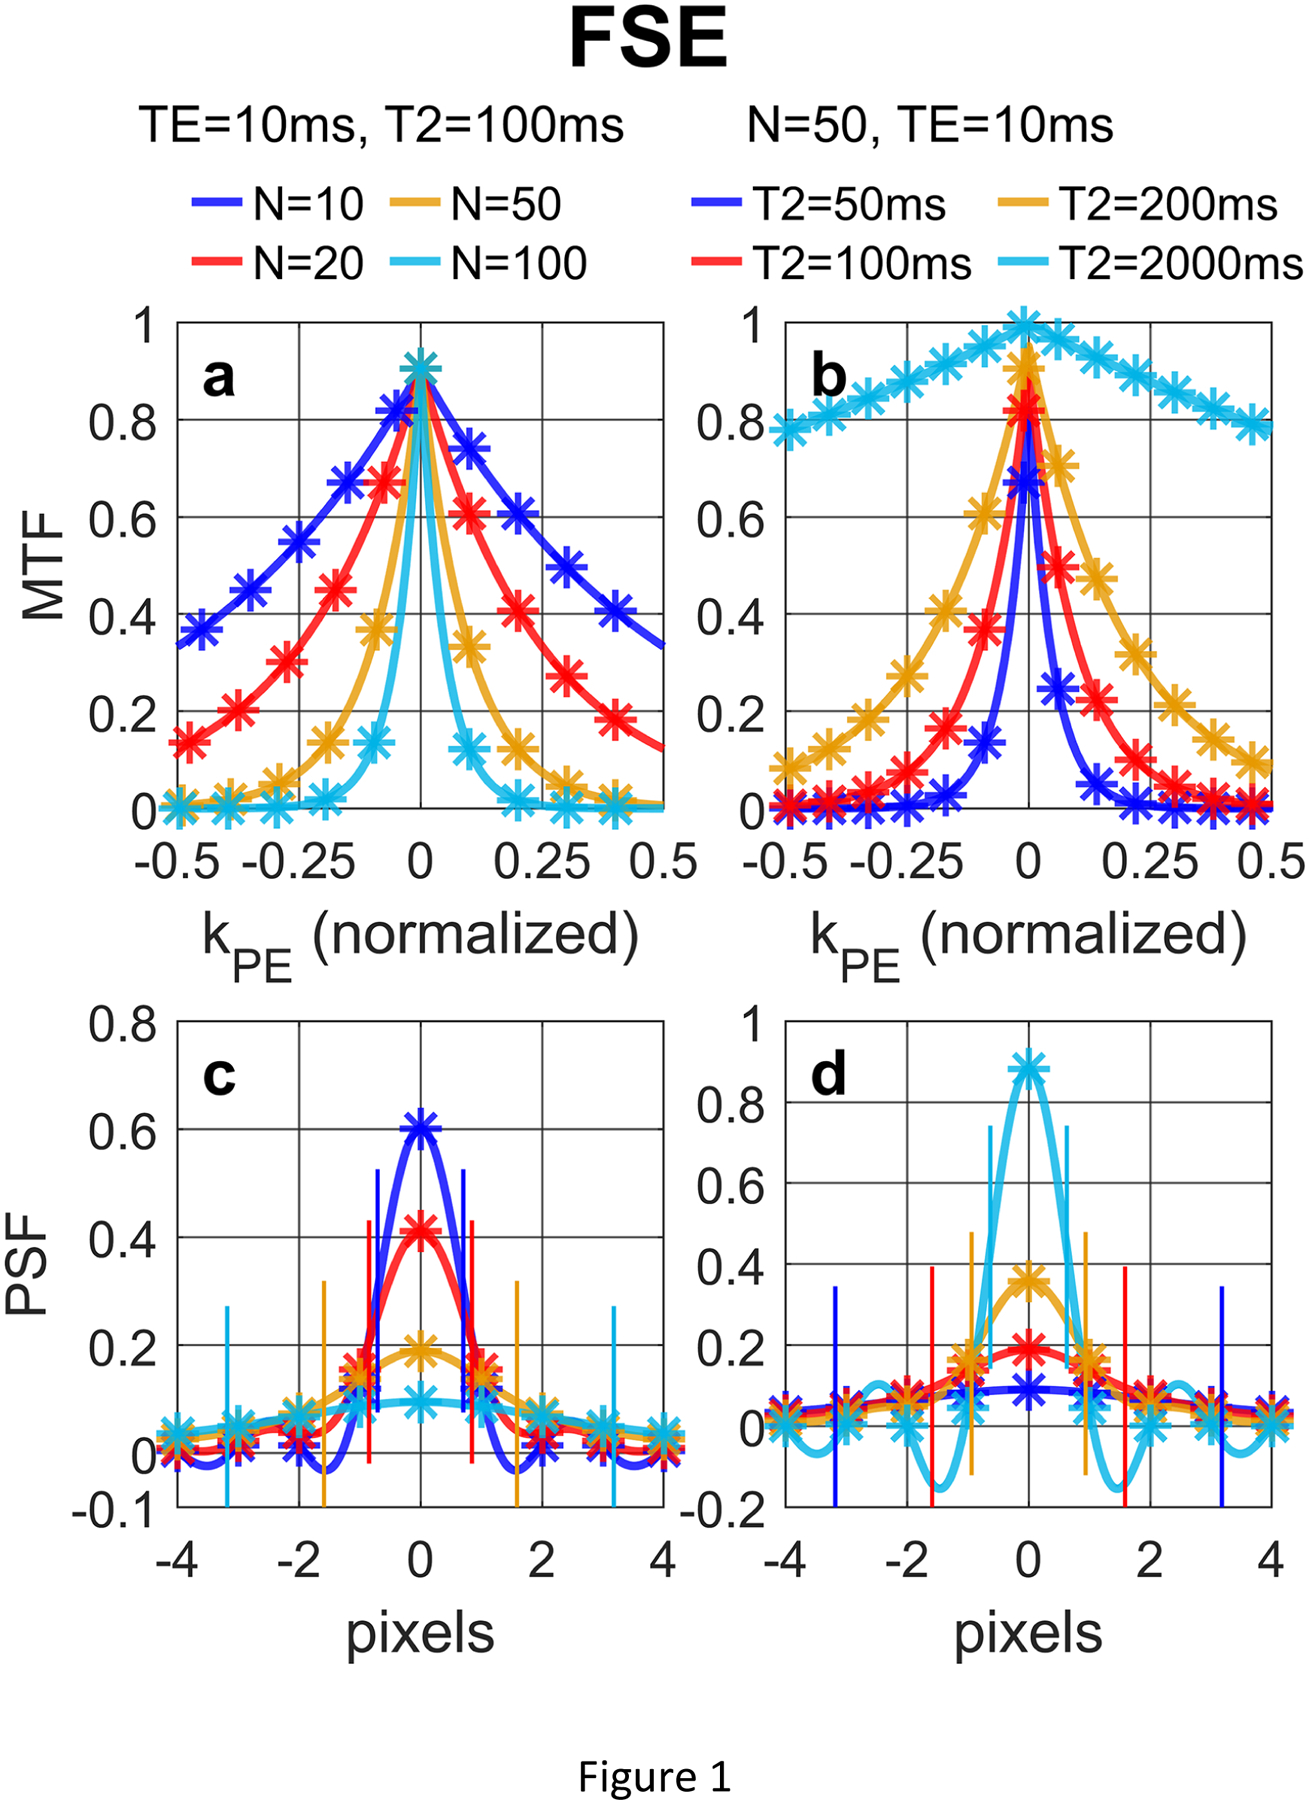
Figure 1:

(a, b) MTF and (c, d) PSF of FSE acquisition with a low-high profile order with different (a, c) N and (b, d) T2 values, following Eqs. (12) and (14), respectively. The analytical results (solid lines) align well with the numerically computed and discretely sampled values (stars) generated via Bloch equation simulations. For FSE, larger N or shorter T2 values lead to both notable signal loss (reduced signal at the center of the PSF) and blurring effect (FWHM labeled with paired vertical bars).
