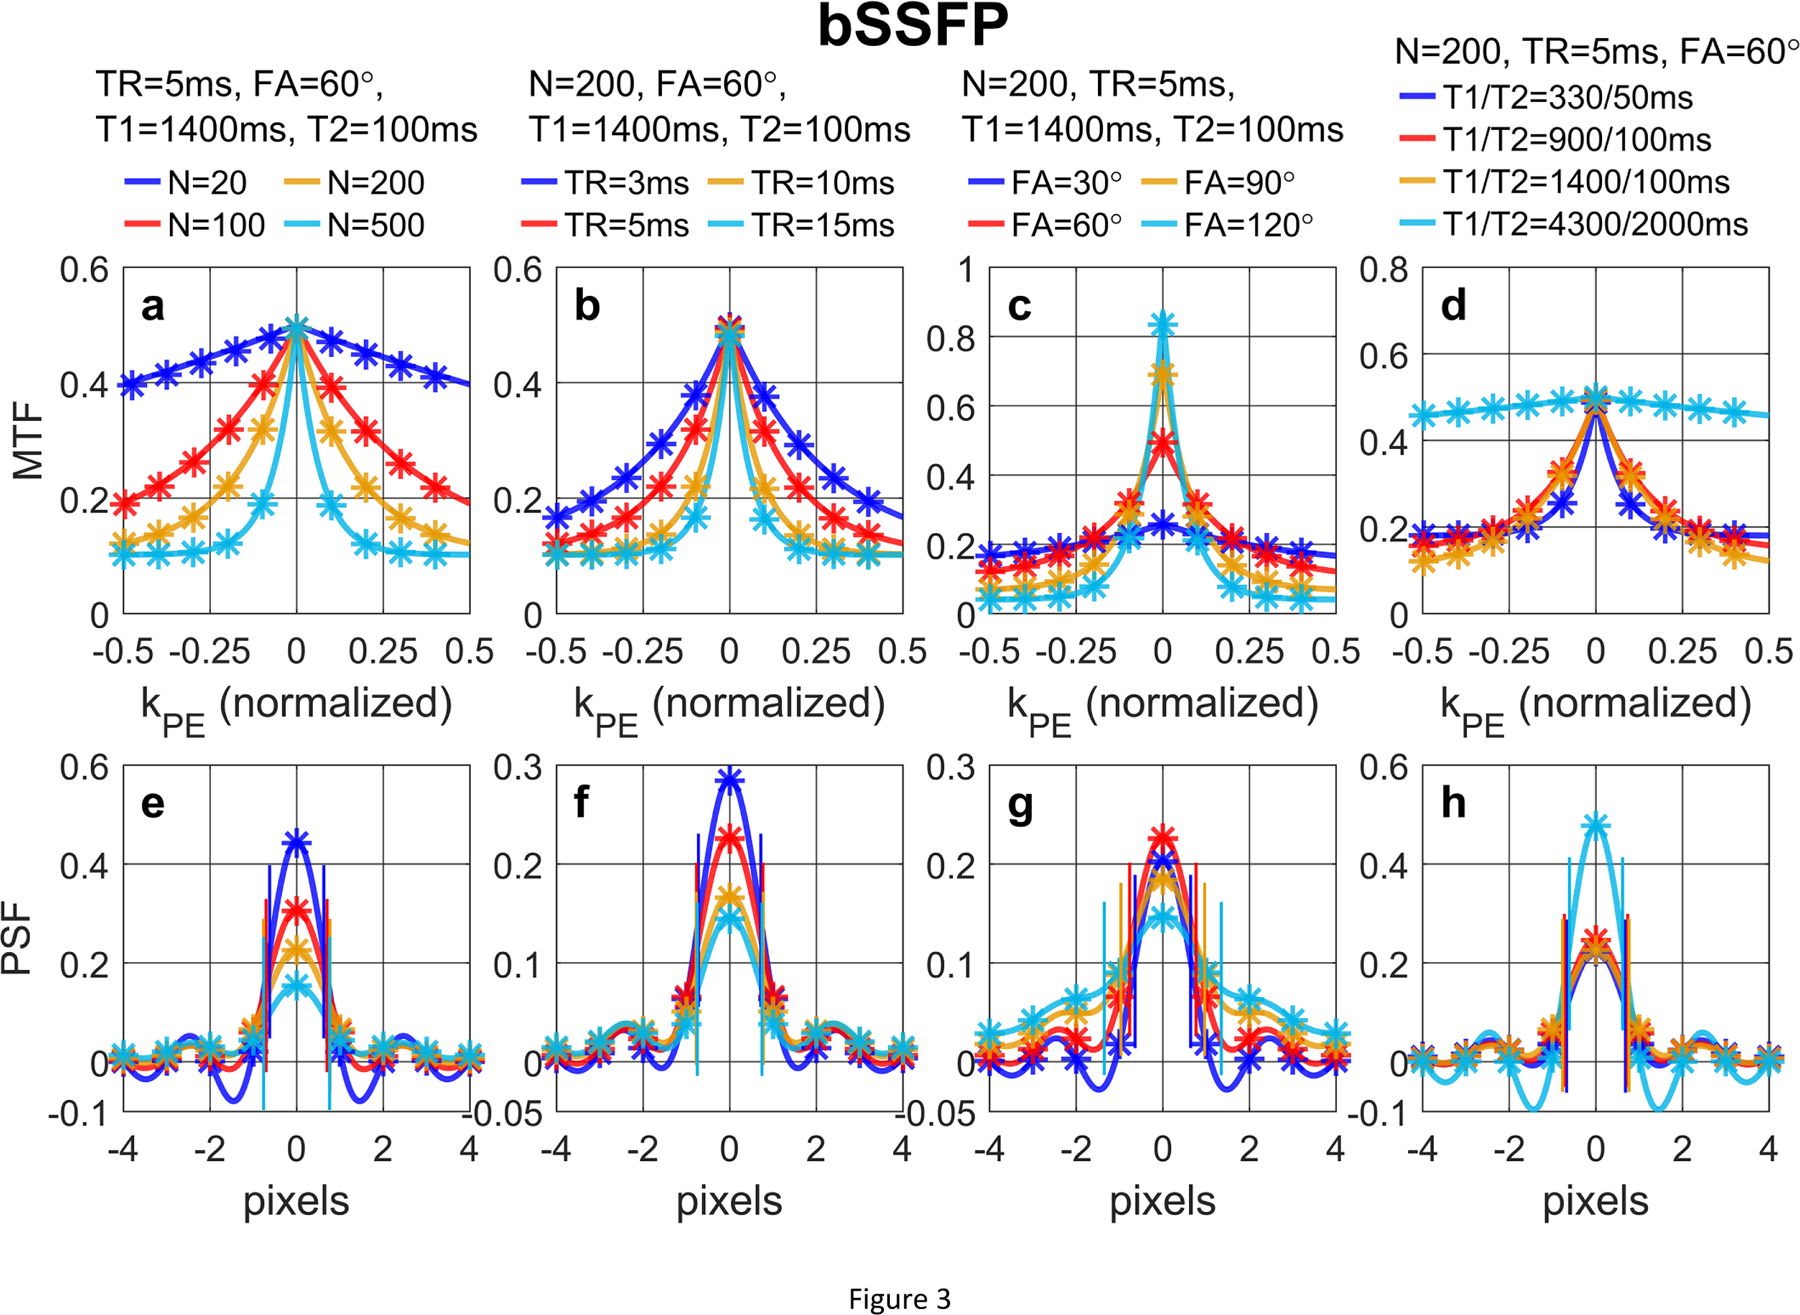
Figure 3:

(a, b, c, d) MTF and (e, f, g, h) PSF of bSSFP acquisition with a low-high profile order with different (a, e) N, (b, f) TR, (c, g) FA, (d, h) T1/T2 values, following Eqs. (40) and (42), respectively. The analytical results (solid lines) align well with the numerically computed and discretely sampled values (stars) generated via Bloch equation simulations. For bSSFP, larger N leads to notable signal loss at the center of the PSF and a small blurring effect (FWHM labeled with paired vertical bars).
