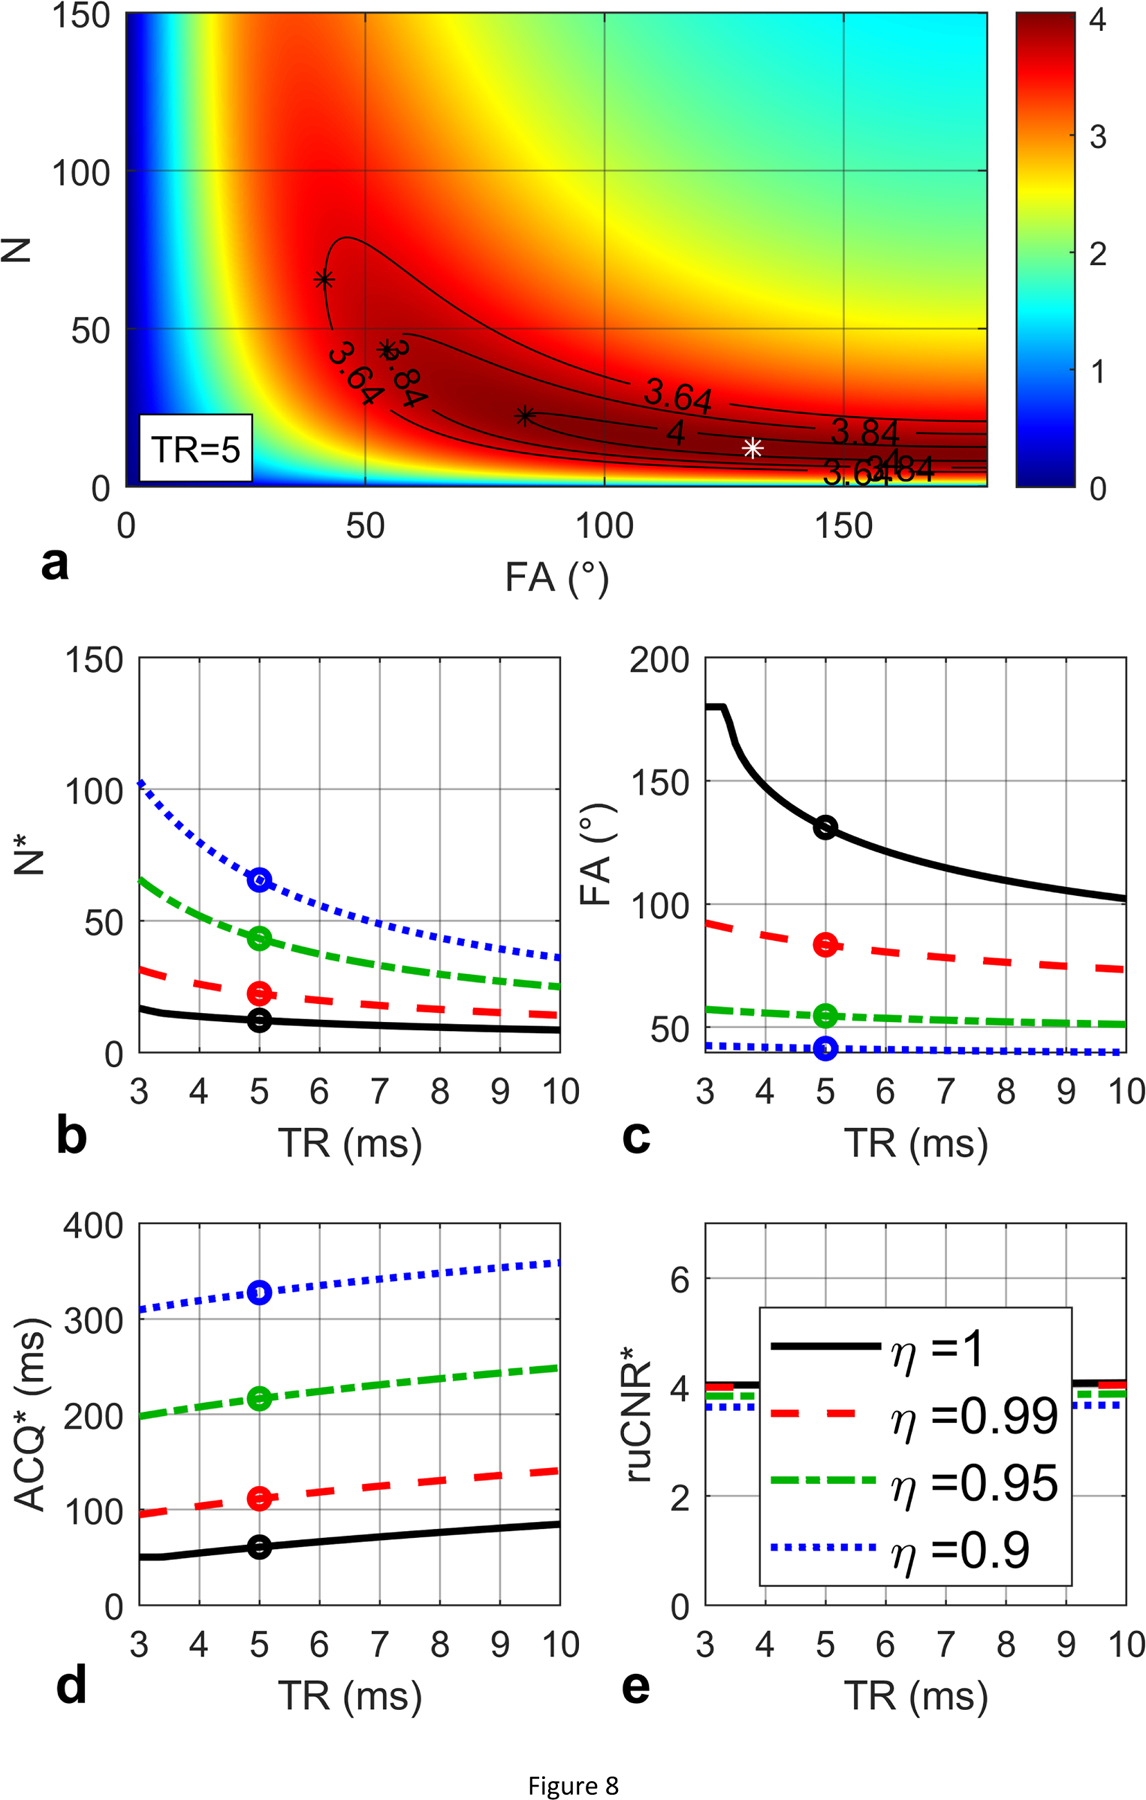
Figure 8:

(a) ruCNR of bSSFP is displayed as a function of N and FA (Eq. (45)) with given TR (5 ms), T1 (1000 ms) and T2 (40 ms) values, for a condition of (3.4 ms). An optimal N and FA pair (12, 131°) is found to maximize ruCNR (4.04, white star). Contours are shown for sacrificed ruCNR when η = 0.99, 0.95, 0.9. (b, c, d, e) The optimal N* and FA* (Eq. (47)), echo train duration N*·TR, and the maximal ruCNRbSSFP (Eq. (48)) are plotted with respect to TR, with black circles indicating the values for TR = 5 ms, which match the white star in (a), and the solid black lines represent the original optimization results when η = 1. The red dashed lines, green dash-dot lines and blue dotted lines represent the corresponding optimization results (Eq. (50)) for optimal N*, FA*, echo train duration, and ruCNR* with varying TR, when η = 0.99, 0.95, 0.9, respectively. For TR = 5 ms and η = 0.99, 0.95, 0.90, (a) the maximal ruCNR* = η · 4.04 = 4.00, 3.84, 3.64 are achieved at N* = 22, 43, 66 and lower FA* = 83°, 55°, 41° (black stars), which match (b, c, d, e) the colored circles in the red dashed, green dash-dot and blue dotted lines.
