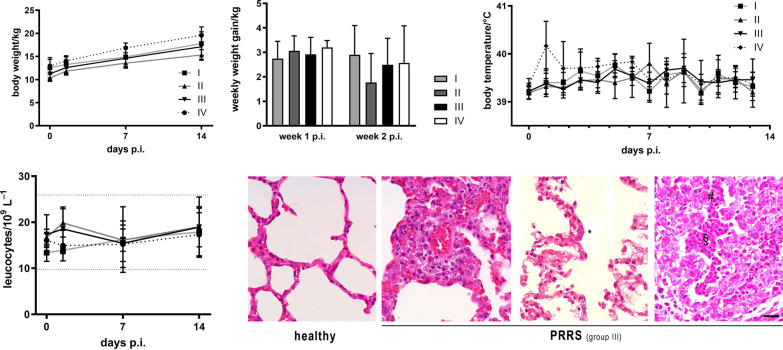
Fig. 6.
Vital parameters after infection. A Average body weight (left) and average weekly weight gain (right) of animals after challenge (mean ± SD). B Average body temperature (mean ± SD); Statistically significant differences between groups (Kruskal–Wallis test, p < 0.05) are described in the result section. C Total leucocyte counts in blood of animals (mean ± SD; dotted lines indicate physiological reference range). D Representative histological images of lung tissue of healthy animals (an animal from group IV before infection) and lung lesions seen 14 days p.i. in animals of all groups (samples from a group-III animal are shown). Typical pathological alterations include occurrence of multinucleated cells (*), alveolar exudate (§) and hypertrophy/hyperplasia of alveolar cells (#). Scale bar, 20 μm

