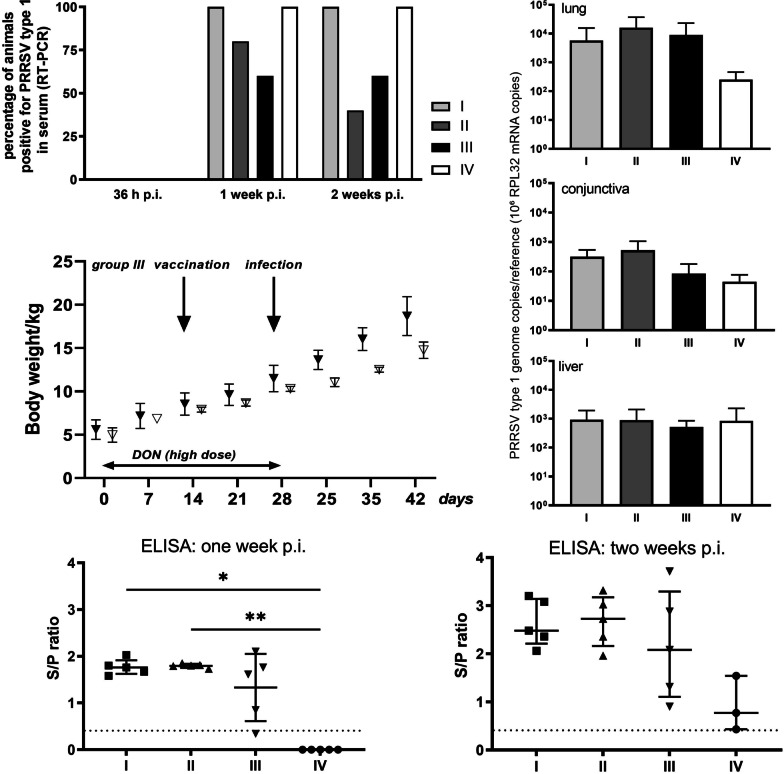
Fig. 7.
Viral parameters after infection. A Percentage of animals positive for PRRSV-1 (challenge strain) genomes in serum as determined by RT-PCR. Total number of animals: 5 in groups I–III, 4 in group IV. The data were analyzed using Chi-square test. B Average numbers of PRRSV-1 genome copies normalised to expression of reference gene RPL32 in the indicated tissues (mean ± SD). The data were analyzed using the Kruskal–Wallis test. C Body weight of the animals in group III (high DON dose). Filled triangles represent the animals which mount a PRRSV-specific antibody response 2 weeks post vaccination (see Fig. 4A). The values of the two piglets that failed to mount a PRRSV-specific antibody response after vaccination are displayed as open triangles. The data were analyzed using the Mann–Whitney test. D PRRSV-specific antibody titres in serum on days 7 (left panel) and 14 (right panel) p.i., determined by ELISA and expressed as ratio of sample/positive control (S/P). Each symbol represents one animal, means ± SD are displayed as horizontal lines; threshold (S/P = 0.4) is indicated with a dashed line. Statistically significant differences (Kruskal–Wallis test, p < 0.05) are indicated with an asterisk

