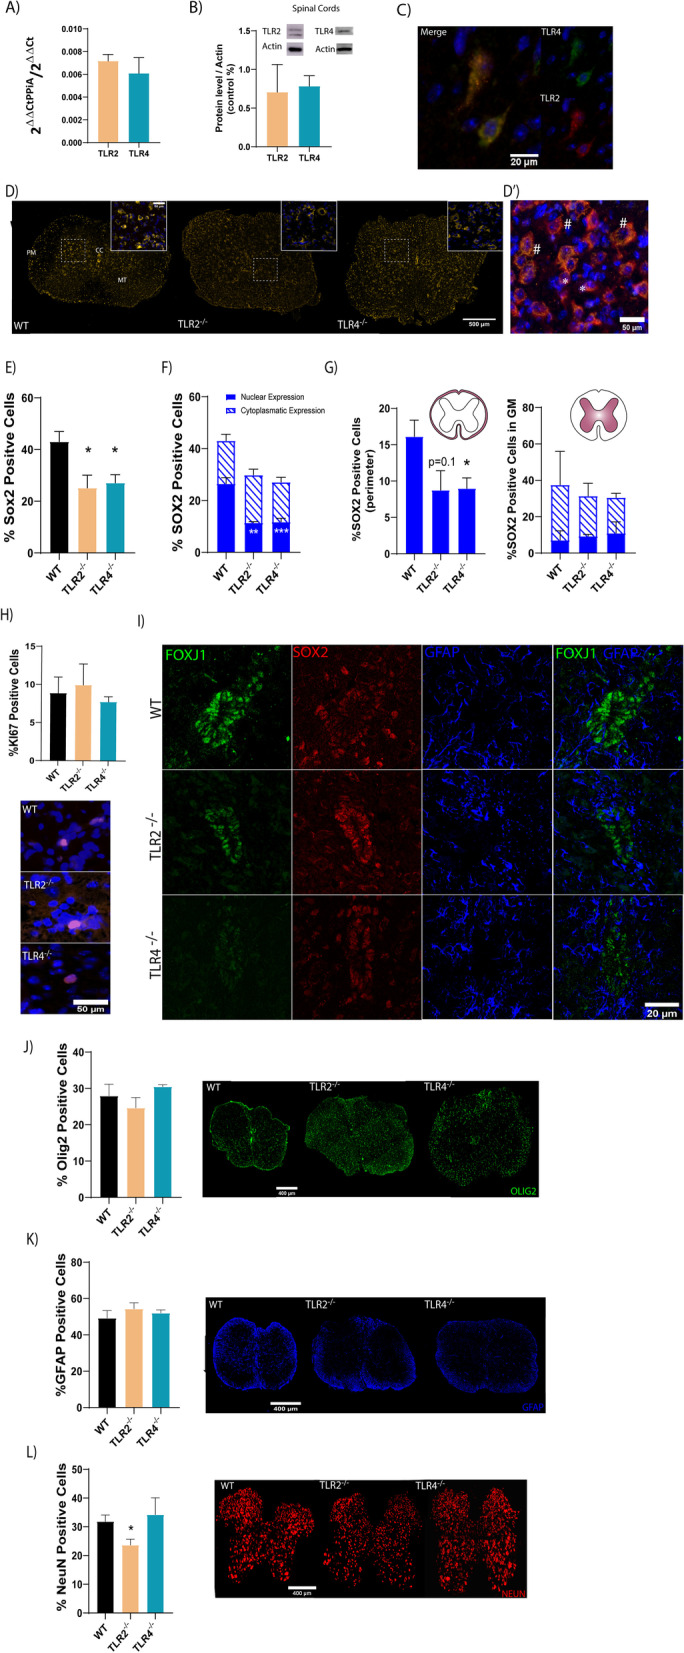
Fig. 1.

Analysis of spinal cord NPCs from WT and TLR2 and TLR4 knockout mice. A Gene expression analysis of TLR2 and TLR4 in the spinal cord tissue of WT mice; B representative Western blots and the overall protein levels of TLR2 and TLR4 from WT spinal cord tissue. β-actin was used as a total protein loading control; C representative image showing double immunoreactivity (merge) for TLR2 (orange) or TLR4 (green) and DAPI (blue-for nuclei counterstaining) in spinal cord coronal slices. A magnified view of the indicated area with a white square for each staining; D representative immunofluorescence images of SOX2 (orange) in spinal cord coronal sections from WT, TLR2−/− and TLR4−/− mice. Inset: higher magnification of the indicated area in the square (Sox2, orange; Dapi, blue); D´) Representative image of typical Sox2 nuclear (*) or cytoplasmic (#) sub-cellular expression (orange) found all three samples, with cytoplasmic co-localization with NeuN (green). E Quantification of Sox2-positive cells expressed as a percentage of the total number of cells. F Quantification of nuclear (full) or cytoplasmic (striped) Sox2-expressing cells as a percentage of the total number of cells in the entire spinal cord area. G Quantification of nuclear (full) or cytoplasmic (striped) Sox2-expressing cells as a percentage of the total number of cells in the grey matter (left) and white matter at the PM (right); H upper panel: quantification of % of cells positive for KI67, lower panels: representative images of Ki67 staining; I representative immunostaining images of the CC of WT, TLR2−/− or TLR4−/− mouse spinal cords. For each genotype individual and merged staining’s are shown for FOXJ (green), SOX2 (red); GFAP (blue); Left graphs: Quantification of Olig2-positive cells (J); GFAP (K) or NeuN (L) expressed as a percentage of the total number of cells stained with DAPI in spinal cord coronal sections; Right panels: representative images for each staining. Data shown as mean ± SEM. Results assessed for normality using the Shapiro–Wilk test and one-way ANOVA with Tukey post hoc test; *p < 0.05; **p < 0.01 or ***p < 0.001 vs. WT
