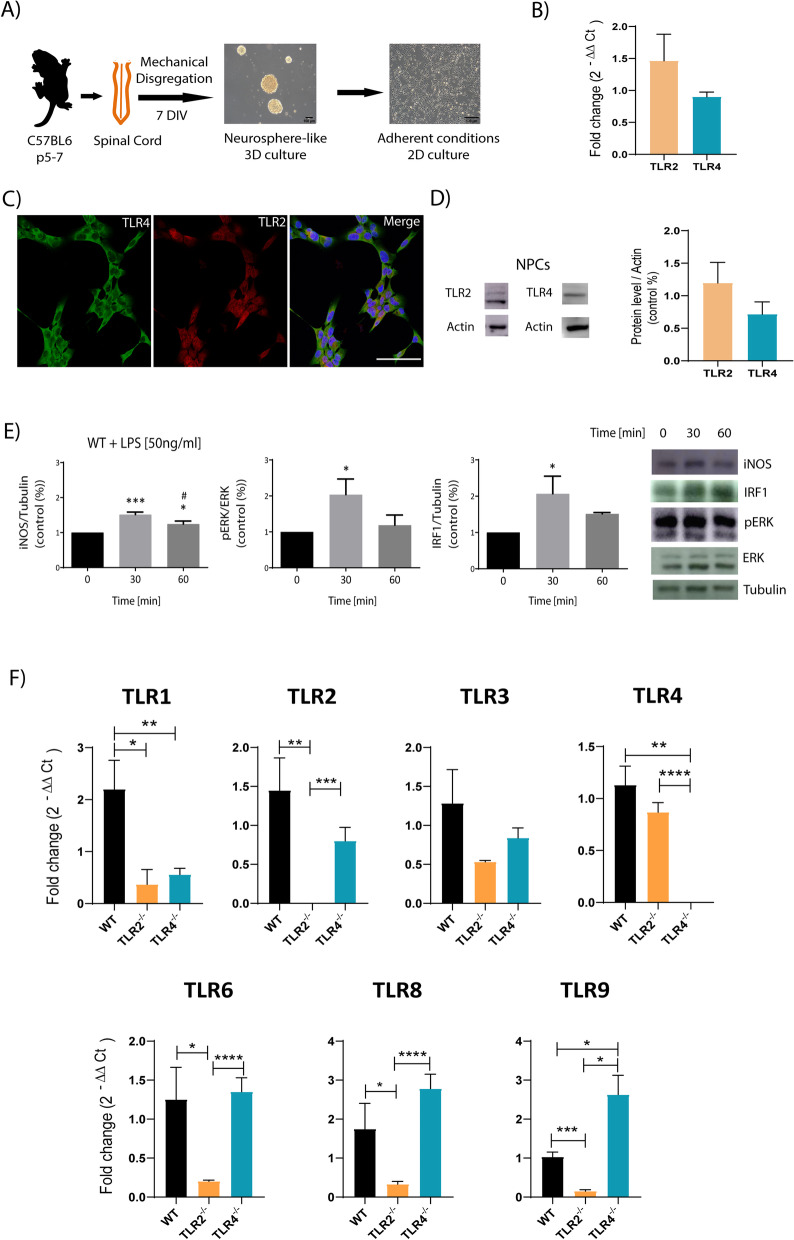
Fig. 2.
TLR2 and TLR4 expression analysis of in vitro-expanded spinal cord NPCs. A Schematic representation of NPC extraction from neonatal mouse spinal cords and their culture in both neurosphere-like 3D and adherent conditions. B Gene expression analysis of TLR2 and TLR4 in WT NPCs. C Representative confocal images showing the expression of TLR4 (green), TLR2 (red), and the co-expression (merge) in WT NPCs grown under adherent conditions. D Representative Western blot and quantification of TLR2 and TLR4 protein expression in WT NPCs grown under adherent conditions. E Densitometric analysis Western blot analysis of iNOS, pERK, and IRF1 levels in response to LPS (50 ng/ml) for 0, 30, or 60 min in WT NPCs grown under adherent conditions and a representative Western blot. Data shown as mean ± SEM (n = 4 per group) compared with the control group (0 min) and two-tailed unpaired t-test was used to analyze significant differences; *p > 0.05; ***p < 0.001 vs. 0 min.; F gene expression analysis of select TLRs in WT, TLR2−/− and TLR4−/− NPCs. Data shown as mean ± SEM (n = 6 per group) and two-tailed unpaired t-test was used to analyze significant differences; *p > 0.05; **p < 0.01; ***p < 0.001; ****p < 0.0001 as indicated

