Fig. 3.
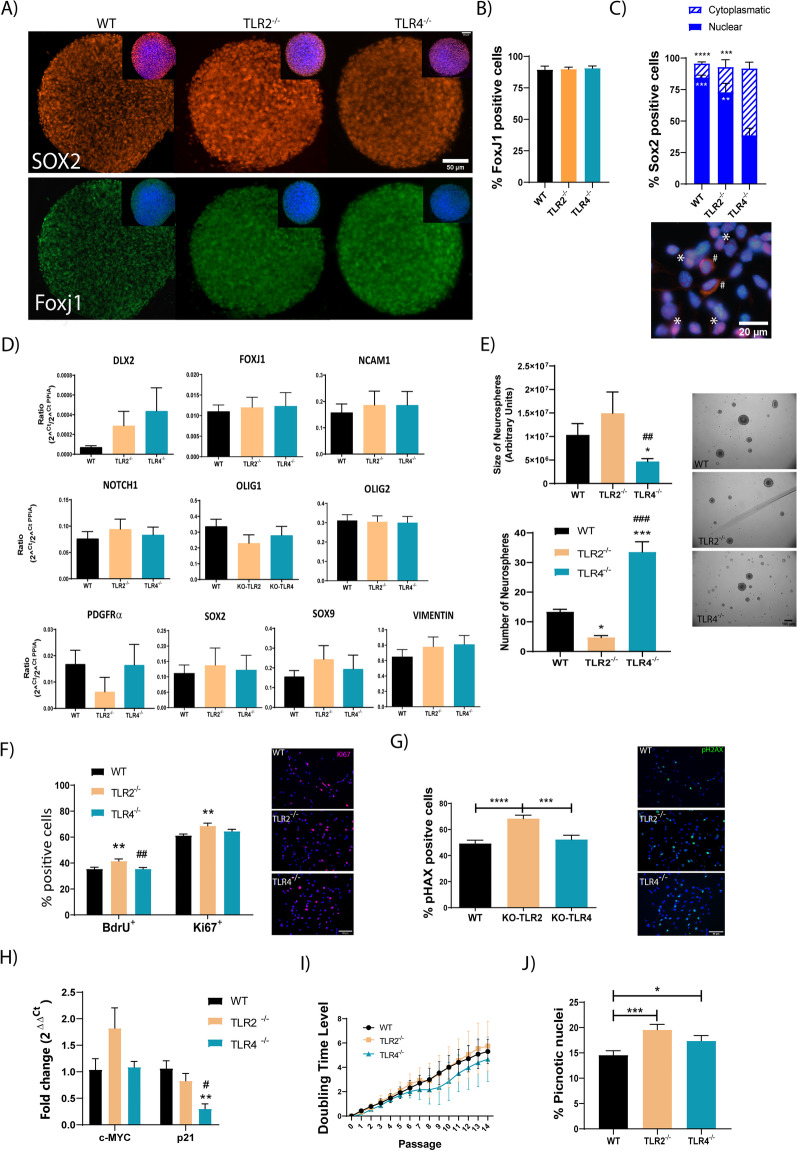
Involvement of TLR2 and TLR4 in the self-renewal of in vitro-expanded spinal cord NPCs. A Representative images of immunofluorescence assay for Sox2 (upper panels, orange) and FoxJ1 (lower panels, green) detection in neurospheres formed using WT, TLR2−/− and TLR4−/− NPCs. Inset: double staining images for Sox2 (orange) or FoxJ1 (green) with DAPI (blue); B Quantification of FoxJ1 positive cells by immunoassay expressed as the percentage of total DAPI positive cells. C
Upper graph: Quantification of Sox2-positive cells represented as nuclear (full) or cytoplasmic expression (striped). Black stars (
 ) vs. TLR4−/− for cytoplasmic Sox2 and White stars (
 ) vs. TLR4−/− for nuclear Sox2. Lower panel: representative image of typical Sox2 nuclear (*) or cytoplasmic (#) expression co-stained with DAPii (blue); D Gene expression analysis in WT, TLR2−/−, and TLR4−/− NPCs of the indicated genes. E Quantification of size (upper graph) and number (lower graph) of neurospheres formed from WT, TLR2−/−, and TLR4−/− NPCs 48 h incubation after unicellular disaggregation. * vs. WT; # vs. TLR2−/−. Representative images of the indicated neurosphere like cultures are shown (right); F (Left) Quantification of BrdU and Ki67 positive cells in WT, TLR2−/− or TLR4−/− NPCs represented as percentages of the total cells. * vs. WT; # vs. TLR2−/−. (Right) Representative images of the double immunofluorescence—BrdU (red) and Ki67 (green). G (Left) Quantification of H2AX positive cells in WT, TLR2−/− or TLR4−/− NPCs represent as percentages of the total cells. * vs. WT; # vs. TLR2−/−. (Right) Representative images of the pH2AX (green) immunofluorescence with DAPI used for nuclei counterstaining (blue) in WT, TLR2−/− or TLR4−/− NPCs. H Gene expression by qPCR of cMYC and p21 transcripts in WT, TLR2−/− and TLR4−/− NPCs. I Population doubling level analysis in WT, TLR2−/− and TLR4−/− NPCs expressed as the mean of three independent experiments. J Quantification of pyknotic nuclei in WT, TLR2−/− and TLR4−/− NPCs from DAPI nuclei staining (identified as smaller than normal with hyper condensate chromatin) represented as a percentage of the total cells. Data shown as mean ± SEM. Results were assessed for normality using the Shapiro–Wilk test and one-way ANOVA with Tukey post hoc test; * or #p < 0,05; ** or ##
p < 0.01; *** or ###p < 0.001; ****p < 0.0001

