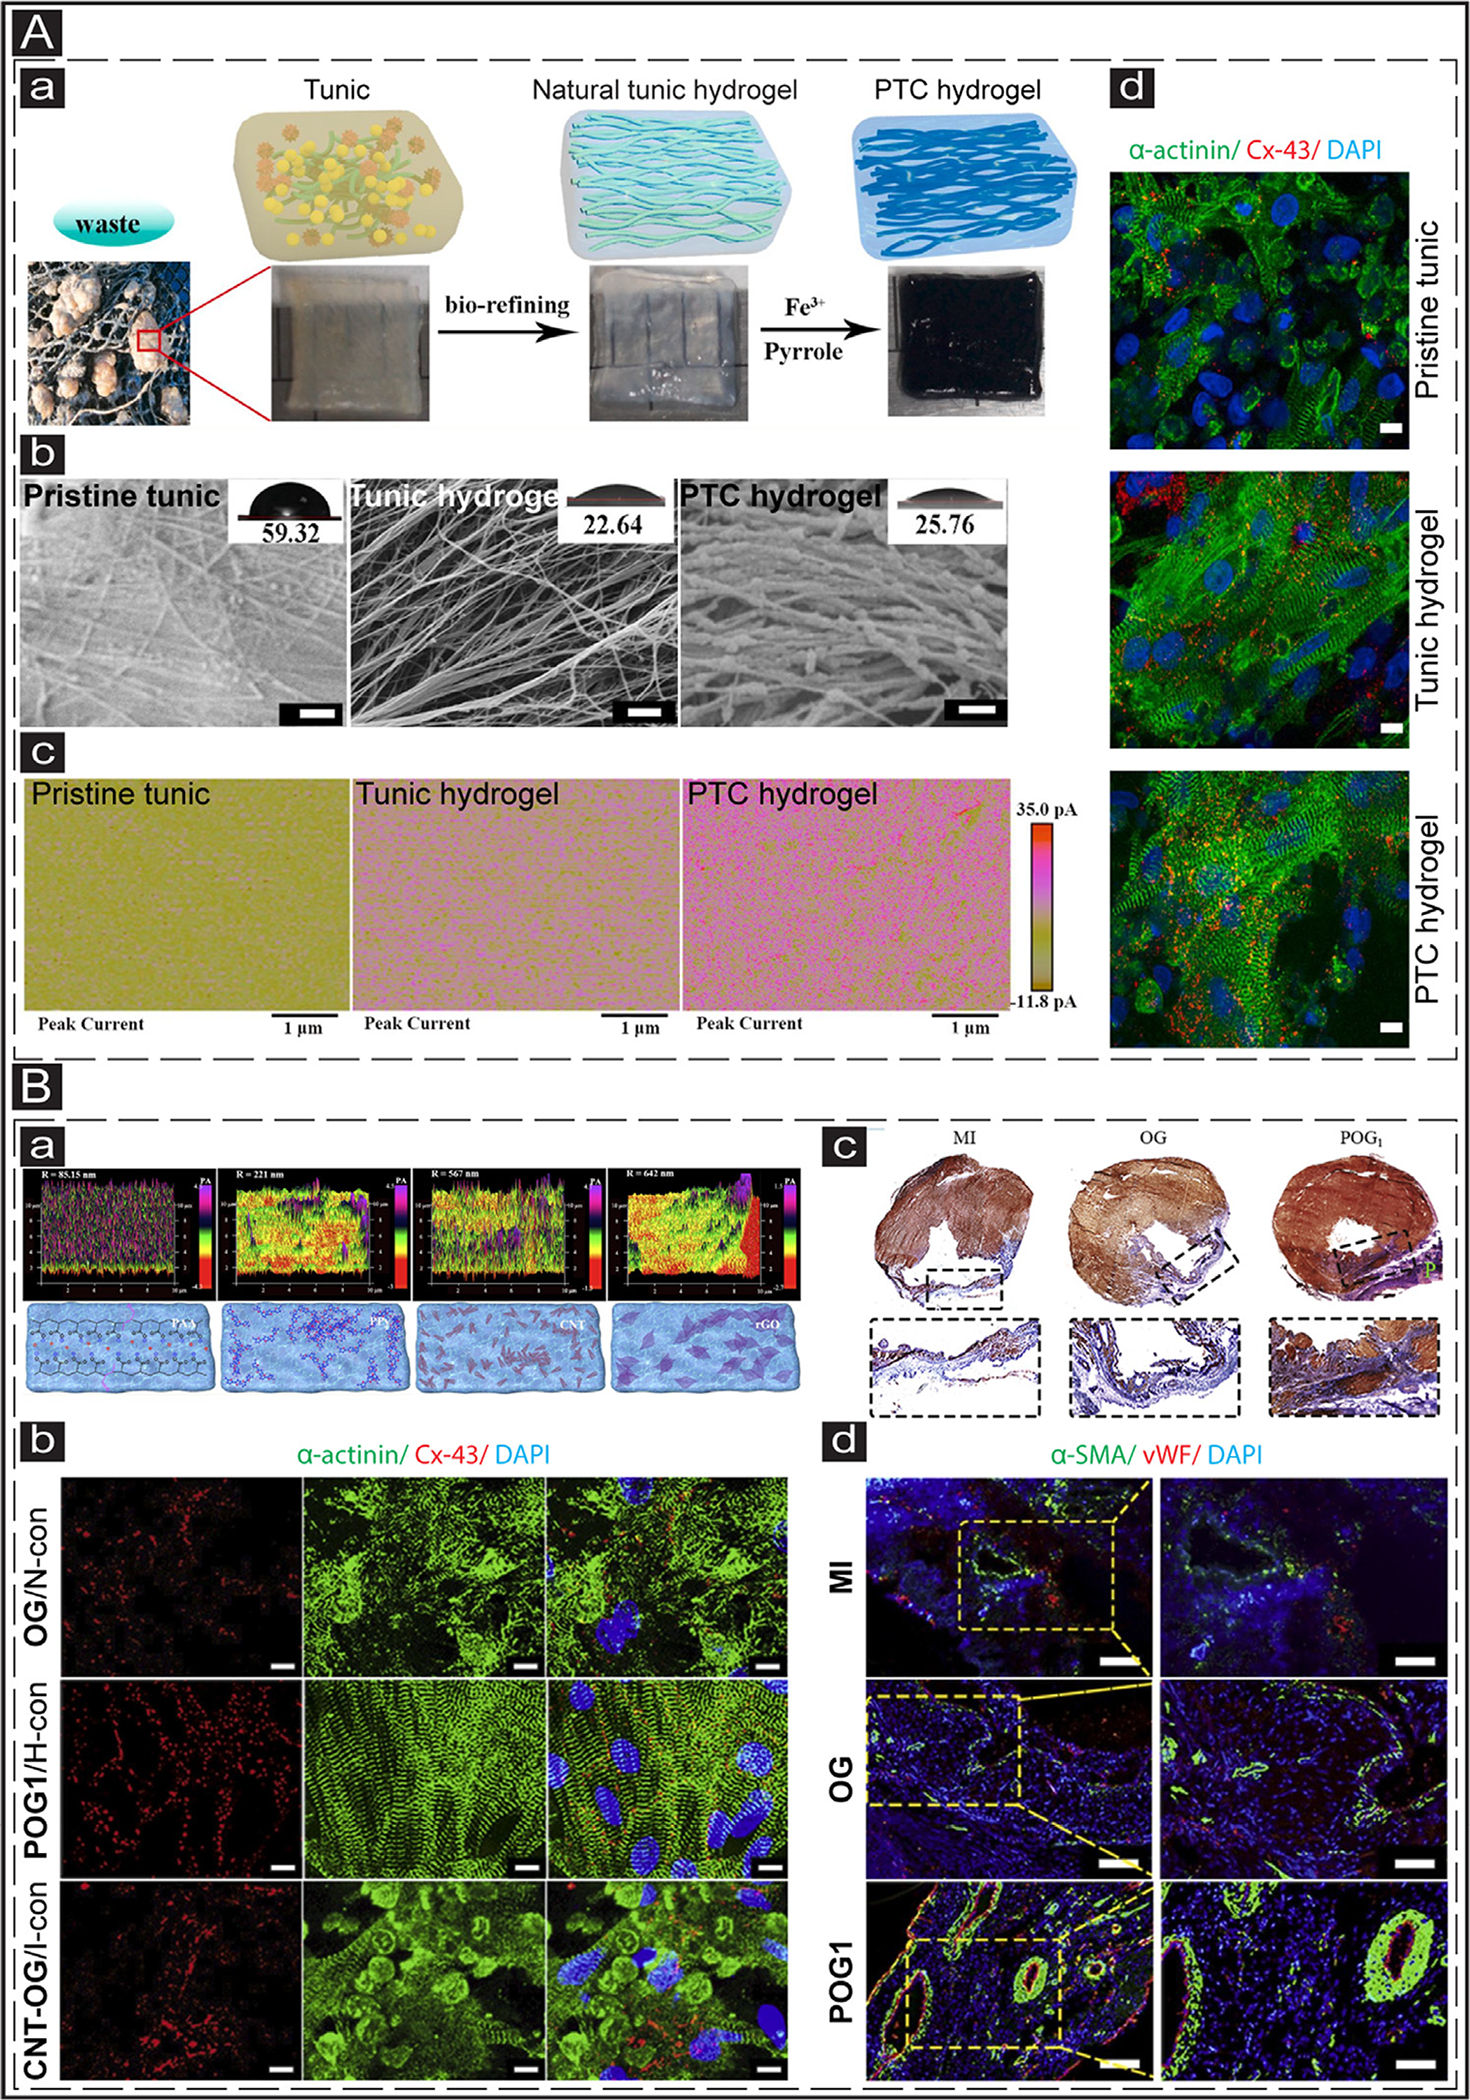
Fig. 8.

Application of animal-based self-conductive and ionic conductive hydrogels in cTE. (A) Fabrication of a functional cardiac patch derived from natural self-conductive tunic cellulose. a: Schematic representing the procedure for preparation of pristine tunic, tunic hydrogel, and PTC hydrogel. b: SEM images showing the structure of the pristine tunic, tunic hydrogel, and PTC hydrogel. The insets show the contact angles of each surface. The scale bar is 200 nm. c: Images show the current distribution within the pristine tunic, tunic hydrogel, and PTC hydrogel measured by e-AFM. d: IF images show the cardiac-specific markers (sarcomeric α-actinin (green) and Cx-43 (red)) expression in the NRVMs cultured on the pristine tunic, tunic hydrogel, and PTC hydrogel. The scale bar is 20 μm. Adapted with permission from [244]. Copyright © 2021, Elsevier. (B) Cardiac patches derived from the ionic conductive hydrogel. a: The conductivity measurement of different hydrogels including POG1, PPy-OG, CNT-OG, and rOG-OG (Upper pictures), using AFM. The lower pictures show the schematic of each hydrogel. b: IF images show the cardiac-specific markers (sarcomeric α-actinin (green) and Cx-43 (red)) expression in the NRVMs cultured on OG/N-con, POG1/H-con, and CNT-OG/I-con for 7 days. The scale bar is 10 μm. N-con: Non-conductive; H-con: High-conductivity; I-con: Inhomogeneous-conductive. c: Masson’s trichrome staining images of the various hydrogel groups (MI, OG, and POG1) after 4 weeks. d: α-SMA (green) and vWF (red) staining with infarct areas at 4 weeks post-transplantation of cardiac patches. The scale bar for column 1 and column 2 is 50 μm and 25 μm, respectively. Adapted with permission from [240]. Copyright © 2021, Elsevier.
