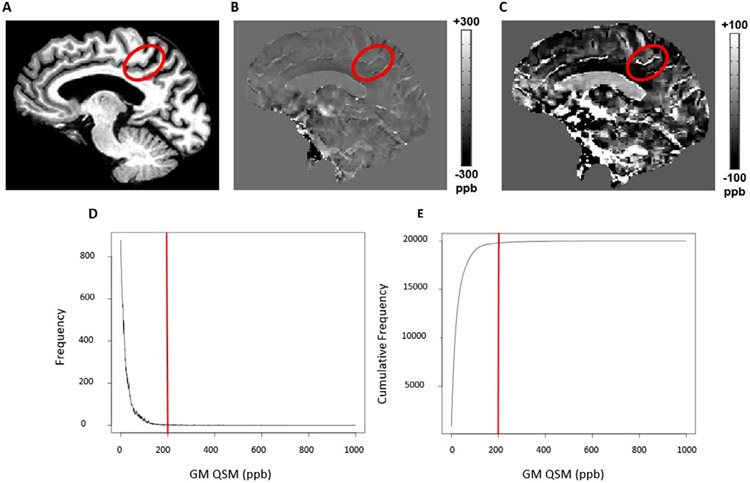
Fig. 3.
Ironsmith detection of outlier values associated with veins. A prominent vein is displayed on QSM images of a single representative participant as well as corresponding QSM values. Panel A highlights a sulcus within the left parietal lobe on a T1 anatomical image. Panel B highlights a vein within this sulcus, depicted on a QSM map at a typical contrast threshold of −300 to 300 ppb. Panel C highlights the same vein as in panel B but the contrast threshold of the QSM map is adjusted to vary between −100 to 100 in order to better highlight the vein. Large veins typically have QSM values around 200 ppb. Panel D is a histogram of positive QSM values in GM for the same participant as panels A, B and C. Panel E shows the cumulative frequency distribution of the GM QSM values in D. In both panels D and E the 200 ppb QSM cut-off threshold is highlighted with a solid red line.

