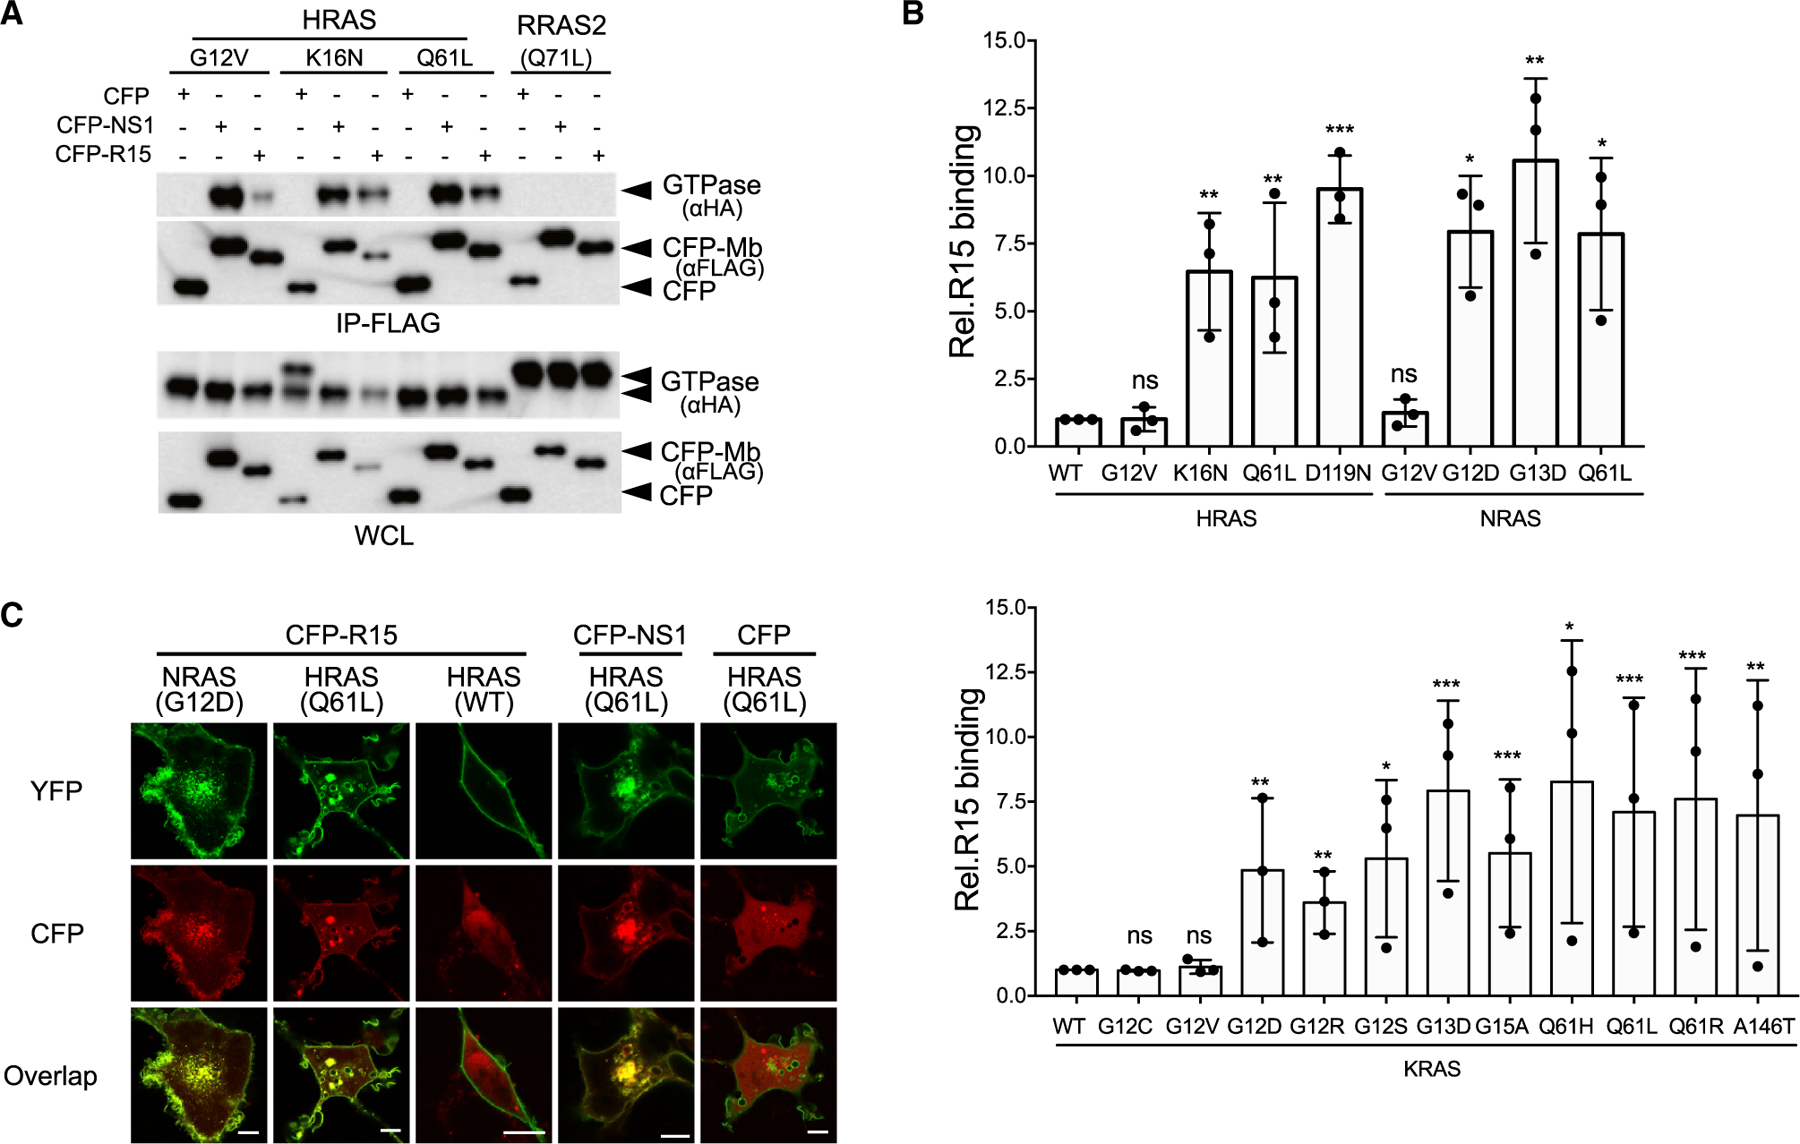
Figure 2. Selectivity of R15 binding to RAS mutants in cells.

(A and B) Coimmunoprecipitation of hemagglutinin (HA)-tagged RAS isoforms with CFP-FLAG-R15.
(A) R15 interaction with HRAS and RRAS2 mutants. IP, immunoprecipitation; WCL, whole-cell lysate.
(B) Quantification of R15 interaction with various oncogenic mutant RAS proteins: HRAS and NRAS (top graph) and KRAS (bottom graph). Plotted values represent the relative binding of R15 to various isoforms of oncogenic mutants compared with wild-type RAS. For HRAS and NRAS mutants, binding is relative to HRAS(WT), and KRAS mutant binding is compared with KRAS(WT). The results represent the average of three biological replicates ± SD. ns, not significant. ***p < 0.0005, **p < 0.005, and *p < 0.05.
(C) Co-localization of CFP-R15, CFP-NS1, or CFP alone (pseudocolored red) with various YFP-tagged RAS proteins (pseudocolored green). Scale bars, 10 μm.
See also Figure S2.
