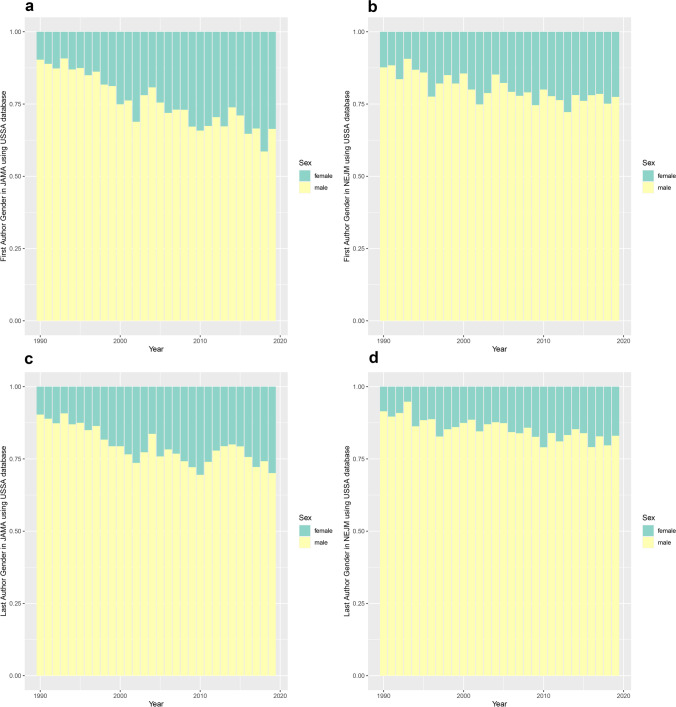
Fig. 2.
Stacked bar charts as a function of year, with color denoting gender membership as predicted using the USSA database, for: the fraction of articles with a first author belonging to a particular gender group in a JAMA and b NEJM; and the fraction of articles with a last (senior) author belonging to a particular gender group in c JAMA and d NEJM. Notes: Consortia and study groups were excluded from this analysis for reasons described in the text

