
Fig. 3.
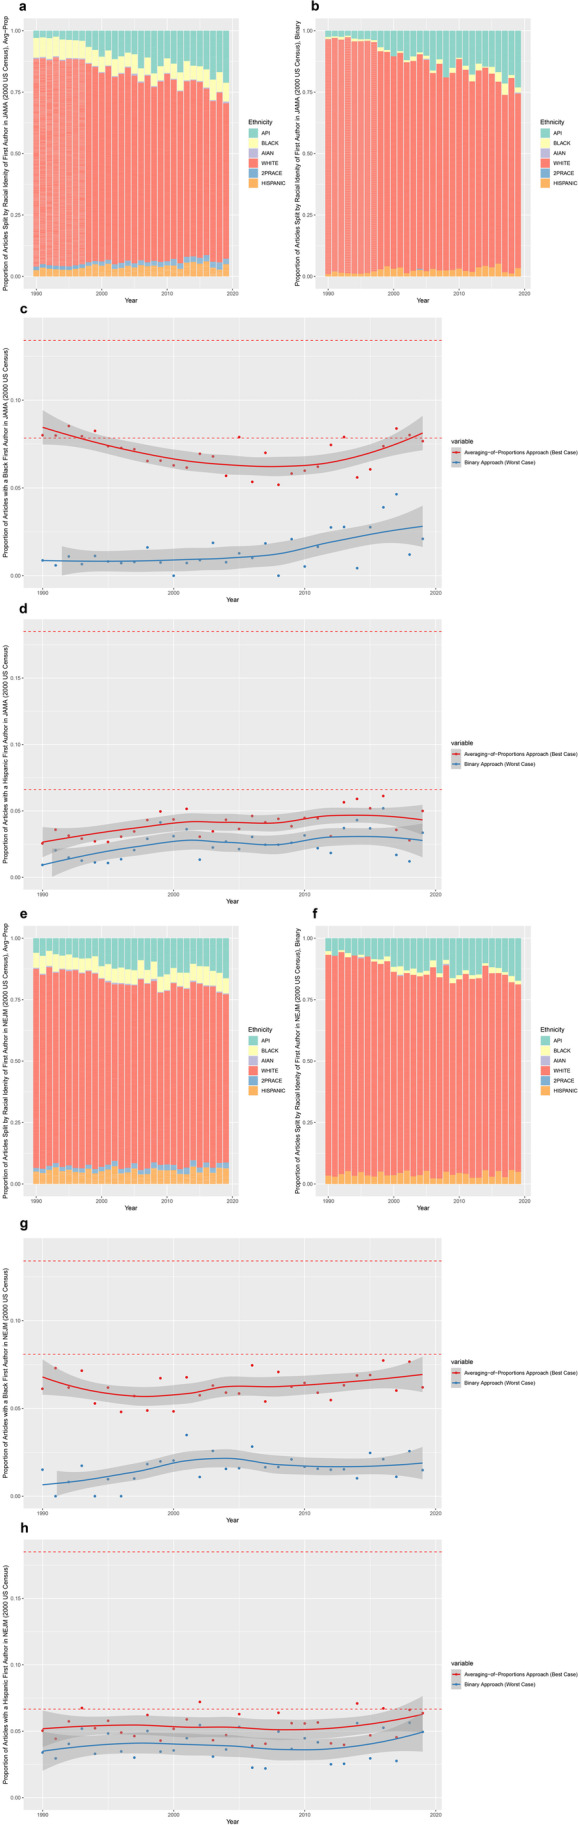
Percent stacked bar chart depicting the probability that a first (junior) author of a research article belongs to any particular racial group, as estimated using the 2000 US census, as a function of year for JAMA using the a averaging-of-proportions approach and b binary approach, with line plots summarizing fraction of articles with a c Black first author and d Hispanic first author; and for NEJM “original articles” using the e averaging-of-proportions approach and f binary approach, with line plots summarizing fraction of articles with a g Black first author and h Hispanic first author. The dashed lines indicates the proportion of Black (13.4%) and Hispanic (18.5%) individuals in the USA in 2019, as well as the proportion of Black (7.9%) and Hispanic (6.8%) individuals with an MD since 2005. Abbreviations: API, non-Hispanic Asian and Native Hawaiian and Other Pacific Islander alone; AIAN, non-Hispanic American Indian and Alaska Native alone; 2PRACE, non-Hispanic two or more races. Notes: These categories and abbreviations are defined by the US Census