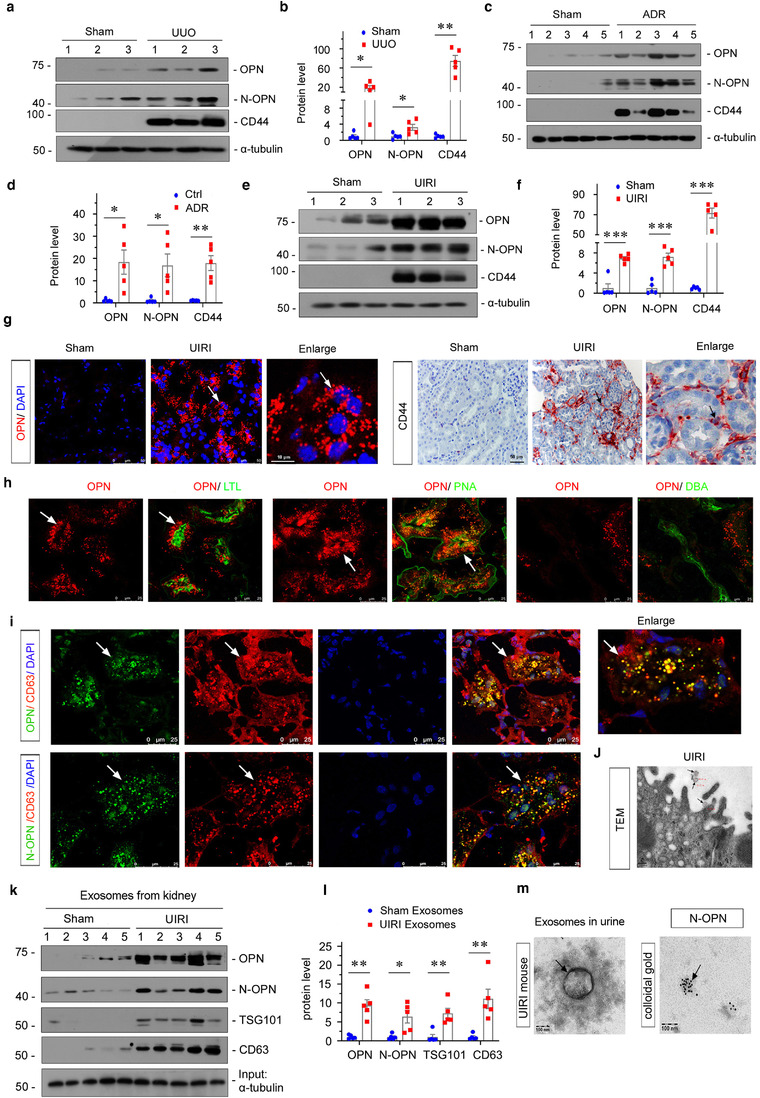
FIGURE 2.

OPN and N‐OPN are upregulated in various models of CKD and encapsulated within tubular exosomes. (a and b) Representative western blots (a) and quantitative data (b) show the induction of renal OPN, N‐OPN and CD44 expression after UUO. Numbers (1 to 3) indicate individual animals in a given group. Relative OPN, N‐OPN and CD44 levels are expressed as fold induction over sham controls after normalization with α‐tubulin. *p < 0.05, **p < 0.01 versus controls (n = 5). (c and d) Western blotting analyses demonstrate renal expression of OPN, N‐OPN and CD44 after injection of Adriamycin (ADR). Numbers (1 to 5) indicate individual animals in a given group. *p < 0.05, **p < 0.01 versus controls (n = 5). (e and f) Western blot analyses show renal expression of OPN, N‐OPN and CD44 protein after UIRI. Numbers (1 to 3) indicate individual animals in a given group. ***p < 0.001 versus controls (n = 5). (g) Representative micrographs of immunofluorescence and immunohistochemical staining show tubular OPN and interstitial CD44 expression in UIRI mice. Arrow indicates positive staining; scale bar: 50 μm. (h) Double immunofluorescence staining demonstrates the generation of OPN predominantly in the proximal and distal tubular epithelium. Kidney sections were co‐stained for OPN (red) and various segment‐specific tubular markers (green). Segment‐specific tubular markers were used as follows: proximal tubule, lotus tetragonolobus lectin (LTL); distal tubule, peanut agglutinin (PNA); and Dolichos biflflorus agglutinin (DBA). Arrow indicates positive staining; scale bar: 25 μm. (i) Double immunofluorescence staining demonstrates that OPN and N‐OPN co‐localize with CD63. Kidney sections were co‐stained for CD63 (red) and OPN or N‐OPN (green). Boxed area is enlarged; Arrow indicates positive staining; scale bar: 25 μm. (j) TEM showing the exosomes released in kidney tissue after UIRI. Arrows indicate exosomes; scale bar: 200 nm. (k and l) Western blot analyses show the presence of OPN, N‐OPN, TSG101 and CD63 proteins in the exosomes isolated from kidneys after UIRI. Exosomes were isolated form kidney tissue of the same weight. Representative western blot (k) and quantitative data (l) are shown. Numbers (1–5) indicate a pool of exosomes isolated from one animal. *p < 0.05, **p < 0.01 versus controls (n = 5). (m) TEM show the exosome isolated from urine of UIRI mice and colloidal gold staining demonstrates that N‐OPN was encapsulated by them. N‐OPN was labelled with 10 nm colloidal gold. Arrow indicates N‐OPN; scale bar: 100 nm
