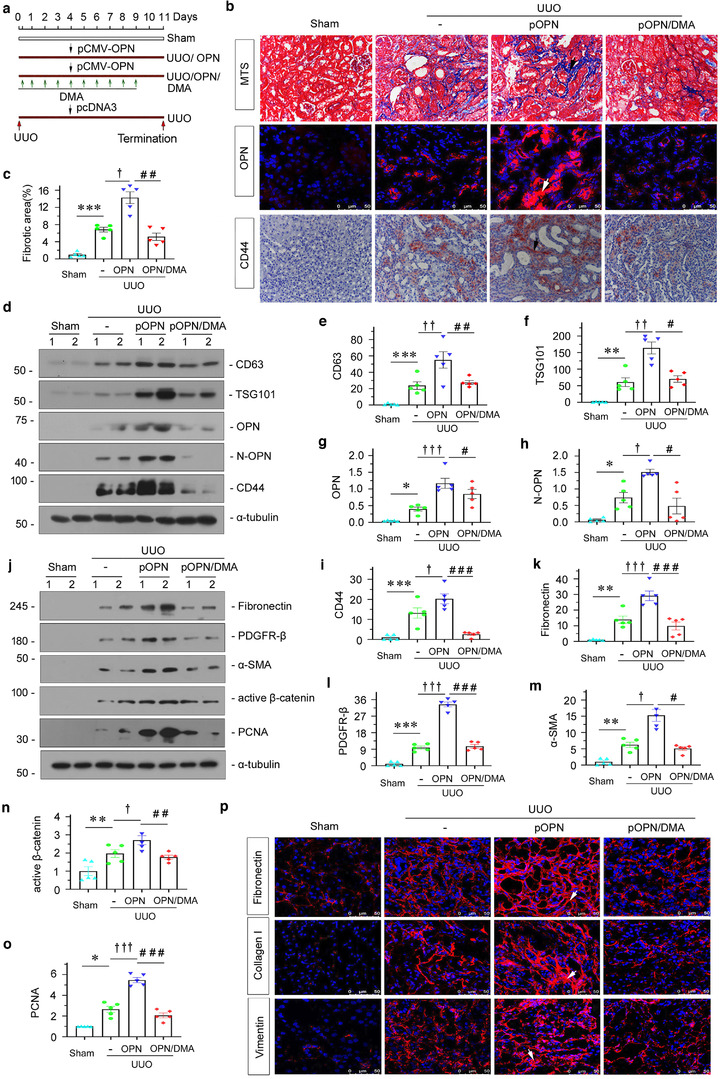
FIGURE 4.

Ectopic OPN promotes renal fibrosis, which is inhibited by the prevention of exosome secretion in a UUO model. (a) Experimental design. Red arrows indicate the time points undergoing UUO and sacrifice. Green arrows indicate dimethyl amiloride (DMA) treatment (10 mg/kg body weight). Black arrow indicates the injection of pcDNA3 or OPN overexpression plasmid (pMCV‐OPN). (b) Representative micrographs showing collagen deposition, OPN and CD44 expression in different groups, as indicated. Kidney sections were subjected to Masson's trichrome staining for collagen deposition (upper), immunofluorescence staining of OPN (middle) and immunohistochemical staining of CD44 (bottom) in different groups, as indicated. Arrow indicates positive staining; scale bar: 50 μm. (c) Graphic presentation showing the quantitative determination of kidney fibrotic lesions in different groups. ***p < 0.001 versus sham controls; † p < 0.05 versus UUO; ## p < 0.01 versus UUO + pCMV‐OPN (n = 5). (d–i) Western blot analyses showing protein expression of CD63, TGS101, OPN, N‐OPN and CD44 in different groups, as indicated. Representative western blot (d) and quantitative data for CD63 (e), TSG101 (f), OPN (g), N‐OPN (h) and CD44 (i) are shown. Numbers (1 to 2) indicate individual animal in a given group. *p < 0.05, **p < 0.01, ***p < 0.001 versus sham controls; † p < 0.05, †† p < 0.01, ††† p < 0.001 versus UUO; # p < 0.05, ## p < 0.01, ### p < 0.001 versus UUO + pCMV‐OPN (n = 5). (j–o) Western blot analyses showing fibrosis‐related protein expression of fibronectin, PDGFR‐β, α‐SMA, active β‐catenin and PCNA in different groups, as indicated. Representative western blot (j) and quantitative data for fibronectin (k), PDGFR‐β (l), α‐SMA (m), active β‐catenin (n) and PCNA (o) are shown. *p < 0.05, **p < 0.01, ***p < 0.001 versus sham controls; † p < 0.05, ††† p < 0.001 versus UUO; # p < 0.05, ## p < 0.05, ### p < 0.001 versus UUO + pCMV‐OPN (n = 5). (p) Representative micrographs showing immunofluorescence staining of fibronectin, collagen I and vimentin in different groups, as indicated. Arrows indicate positive staining; scale bar: 50 μm
