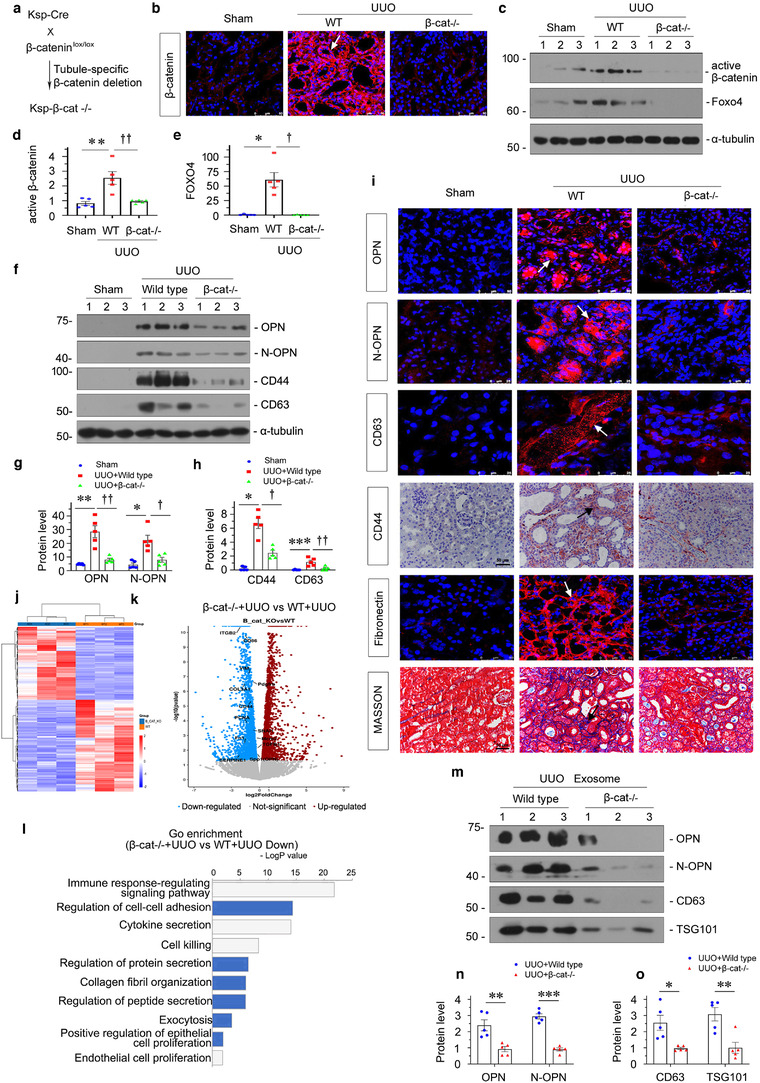
FIGURE 7.

Tubule‐specific ablation of β‐catenin attenuates renal fibrosis through blocking exosomal OPN/CD44 axis signalling. (a) Experimental design showing the strategy of crossbreeding of the β‐catenin‐floxed mice (β‐catfl/fl) with Cre transgenic mice under the control of the Ksp‐cadherin promoter (Ksp‐Cre). (b) Representative immunofluorescence staining of β‐catenin in different groups, as indicated. Arrow indicates positive staining; scale bar: 50 μm. (c–e) Western blot analyses showing renal expression of active β‐catenin and Foxo4 in different groups of mice at 7 days after UUO. Representative western blot (c) and quantitative data of β‐catenin (d) and Foxo4 (e) are shown. *p < 0.05, **p < 0.01 versus sham; † p < 0.05, †† p < 0.01 versus WT UUO mice (n = 5). (f–h) Western blot analyses showing renal expression of OPN, N‐OPN, CD44 and CD63 in different groups, as indicated. Representative western blot (f) and quantitative data of OPN and N‐OPN (g), and CD44 and CD63 (h) are presented. *p < 0.05, **p < 0.01, ***p < 0.001 versus sham controls; † p < 0.05, †† p < 0.01 versus WT UUO mice (n = 5). (i) Representative micrographs showing immunofluorescence staining of OPN, N‐OPN, CD63 and fibronectin; immunohistochemical staining of CD44 and collagen deposition assessed by Masson's trichrome staining in different groups, as indicated. Arrows indicate positive staining; scale bar: 50 μm. (j) Gene expression profiling by RNA‐seq shows differential gene clustering of kidney from wild type (WT) UUO mice or tubule specific β‐catenin knockout (β‐cat−/−) UUO mice. (k) Volcano plot showing the differentially expressed genes of the two groups, as indicated. (l) Gene ontology (GO) enrichment analysis reveals that several biological processes were enriched, as indicated. (m–o) Western blot analyses showing that the expression of OPN, N‐OPN, CD63 and TSG101 protein in exosomes isolated from WT UUO or β‐cat−/− UUO mice. Exosomes were isolated form kidney tissue of the same weight. Representative western blot (m) and quantitative data of OPN and N‐OPN (n), and CD63 and TSG101 (o) are presented. Numbers (1 to 3) indicates individual animal in a given group. **p < 0.01, ***p < 0.001 versus wild‐type UUO mice (n = 5)
