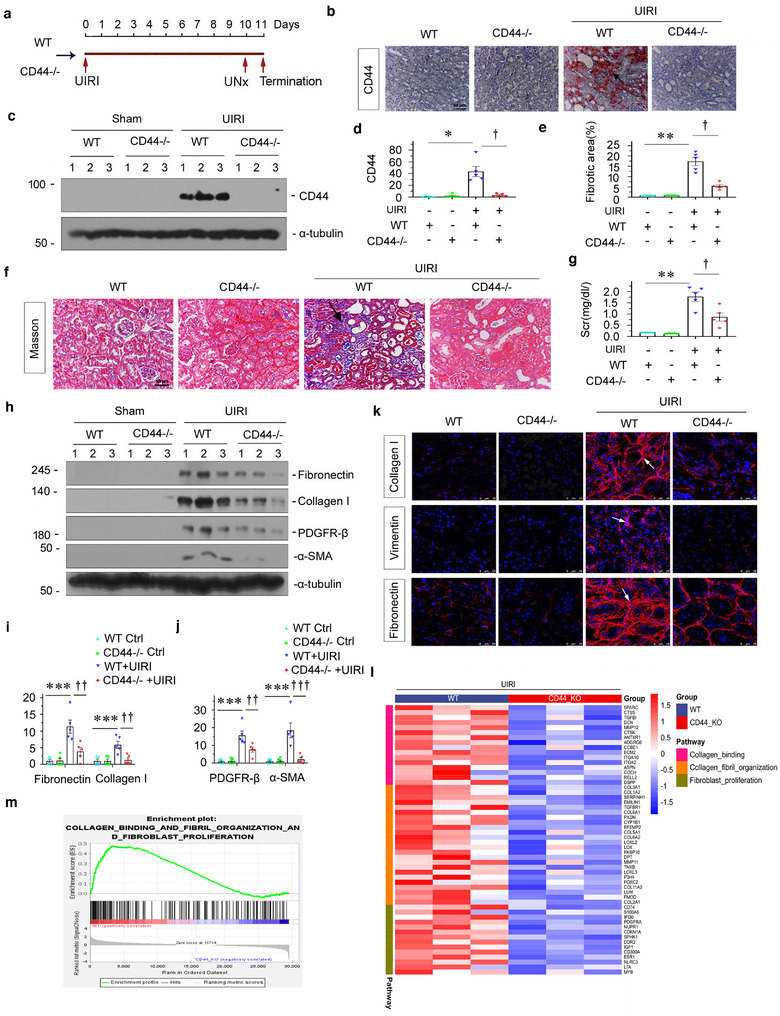
FIGURE 8.

Knockout of CD44 decreases kidney fibrosis in UIRI model. (a) Diagram showing the experimental design. Red arrows indicate the time points when wild‐type mice or CD44 knockout mice undergoing UIRI, UNx and sacrifice. (b) Representative immunohistochemical staining of CD44 in different groups, as indicated. Arrow indicates positive staining; scale bar: 50 μm. (c and d) Western blot shows that knockout of CD44 in mice abolished CD44 expression at 11 days after UIRI. Representative western blot (c) and quantitative data (d) are shown. Numbers (1 to 3) indicate individual animal in a given group. *p < 0.05 versus wild‐type controls; † p < 0.05 versus wild‐type UIRI mice (n = 5). (e) Graphic presentation showing the quantitative determination of kidney fibrotic lesions in different groups. **p < 0.01 versus wild‐type controls; † p < 0.05 versus wild‐type UIRI mice (n = 5). (f) Representative micrographs show collagen deposition assessed by Masson's trichrome staining in different groups. Arrow indicates positive staining; scale bar: 50 μm. (g) Graphic presentation showing the serum creatinine levels in different groups. **p < 0.01 versus wild‐type controls; † p < 0.05 versus wild‐type mice with UIRI surgery (n = 5). (h–j) Western blot showing that knockout of CD44 abolished renal expression of fibrosis‐related proteins in mice at 11 days after UIRI. Representative western blot (h) and quantitative data on fibronectin and collagen I (i), and PDGFR‐β and α‐SMA (j) are shown. Numbers (1 to 3) indicate individual animal in a given group. ***p < 0.001 versus wild‐type controls; †† p < 0.01, ††† p < 0.001 versus wild‐type mice with UIRI surgery (n = 5). (k) Representative micrographs show the expression of collagen I, vimentin and fibronectin in different groups, as indicated. Kidney sections were stained with antibodies against collagen I (upper), vimentin (middle) and fibronectin (bottom), respectively. Arrows indicate positive staining; scale bar: 50 μm. (l) Gene expression profiling by RNA‐seq shows differential gene clustering of kidney from wild type (WT) UIRI mice or CD44 (CD44−/−) knockout UIRI mice. (m) GSEA analysis shows the collagen binding and fibril organization and fibroblast proliferation decreased in CD44−/− UIRI mice compared with WT UIRI mice
