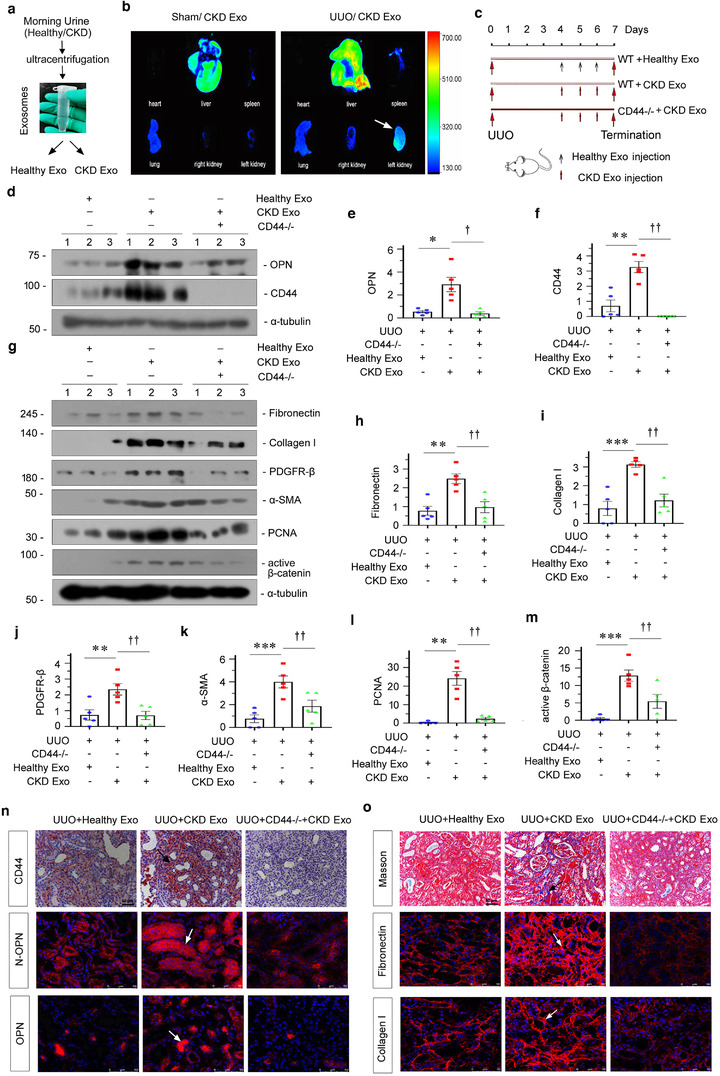
FIGURE 9.

Tubular cell‐derived exosomal OPN plays a central role in promoting renal fibrosis. (a) Schematic diagram showing obtaining exosomes. (b) Urinary exosomes from patients with CKD were labelled with fluorescent lipophilic membrane dye Dil. Mice were injected by tail vein with urinary exosome from patients with CKD. Fluorescent images of organs were acquired using a Bruker Small Animal Optical Imaging System. Sham (left) and CKD mice (right) were injected with exosome labelled with Dil by the tail vein. The fluorescence luminescence of the heart, lung, liver, spleen and kidney was assessed at 12 h after injection. (c) Experimental design. Large red arrows indicate the time points undergoing UUO and termination, respectively. Small black arrows indicate the time points when exosomes derived from the urine of healthy subjects (Healthy‐Exo 200 μg) were injected intravenously. Small red arrows indicate when exosomes derived from urine of CKD patients (CKD‐Exo 200 μg) were injected intravenously. (d–f) Western blot showing that knockout of CD44 in mice injected with exosomes derived from patients with CKD abolished OPN and CD44 expression at 7 days after UUO. Representative western blot (d) and quantitative data of OPN (e) and CD44 (f) are shown. Numbers (1 to 3) indicate individual animal in a given group. *p < 0.05, **p < 0.01 versus UUO mice treated with Healthy‐Exo; † p < 0.05, †† p < 0.01 versus UUO mice treated with CKD‐Exo (n = 5). (g–m) Western blot analyses showing renal expression of fibronectin, collagen I, PDGFR‐β, α‐SMA, PCNA and active β‐catenin in different groups, as indicated. Representative western blot (g) and quantitative data of fibronectin (h), collagen I (i), PDGFR‐β (j) and α‐SMA (k), PCNA (l) and active β‐catenin (m) are shown. Numbers (1 to 3) indicate individual animal in a given group. **p < 0.01, ***p < 0.001 versus UUO mice treated with Healthy‐Exo; †† p < 0.01 versus UUO mice treated with CKD‐Exo (n = 5). (n) Kidney tissues from different groups were subjected to immunostaining for CD44 (upper), immunofluorescence staining of N‐OPN (middle) and OPN (bottom). Images demonstrate that knockout of CD44 in UUO mice injected with exosomes from patients with CKD abolished OPN and N‐OPN expression in mice at 7 days after UUO. Arrow indicates positive staining; scale bar: 50 μm. (o) Representative micrographs showing collagen deposition, as well as fibronectin and collagen I expression in different groups, as indicated. Kidney sections were subjected to Masson's trichrome staining for collagen deposition (upper), and immunofluorescence staining of fibronectin (middle) and collagen I (bottom). Arrow indicates positive staining; scale bar: 50 μm
