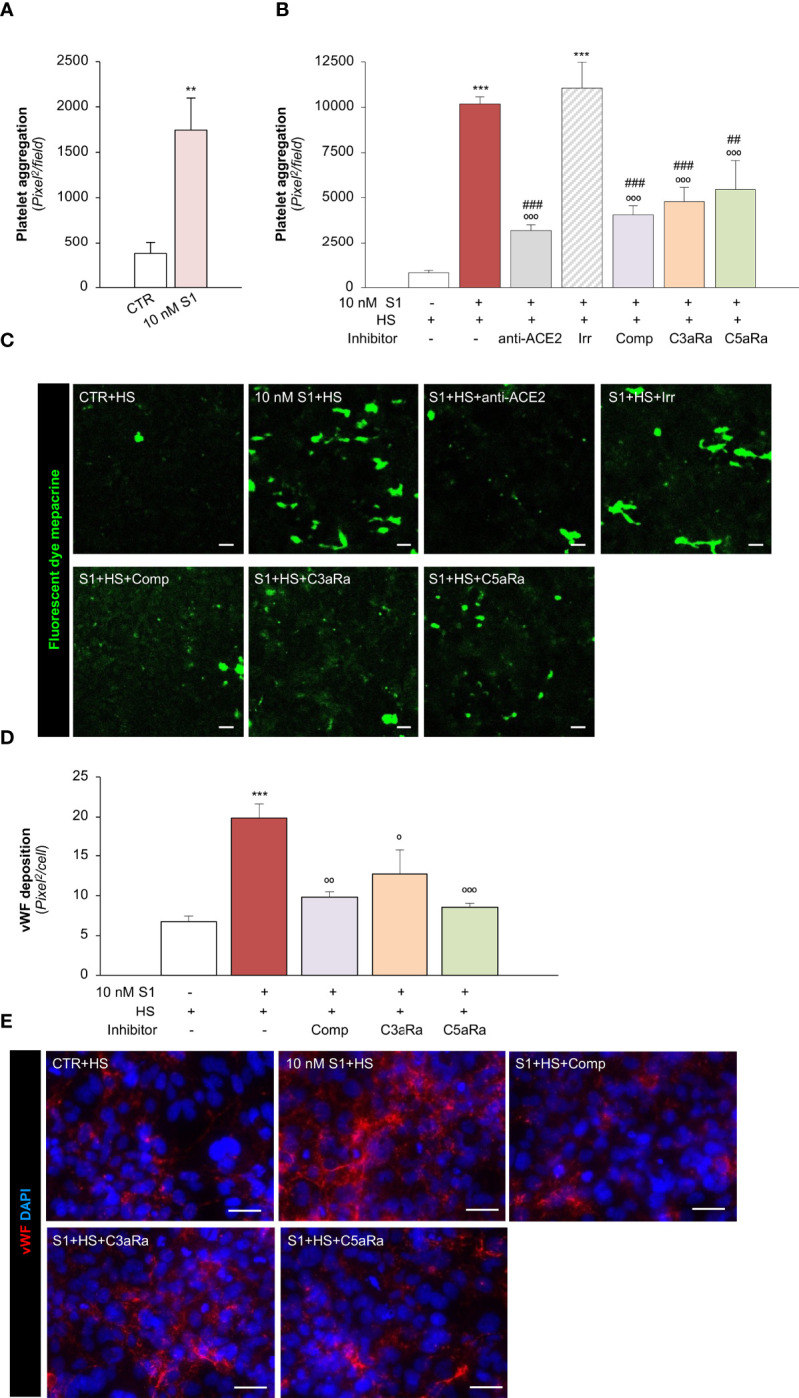
Figure 5.

S1 activates the complement system amplifying platelet aggregate formation on HMEC-1 through ACE2. (A) Quantification of platelet aggregate formation on HMEC-1 pre-exposed for 24h to medium alone (CTR) or S1 (10 nM). Platelets aggregates on HMEC-1 perfused with heparinised blood under flow conditions (60 dynes/cm2) were evaluated and expressed as pixels2/field analysed. (B, C) Quantification (B) and representative images (C) of platelet aggregate formation on HMEC-1 pre-exposed for 24h to medium alone (CTR), S1 (10 nM), or 10 nM S1 in the presence of anti-ACE2 Ab (2 μg/ml) or the corresponding Irr Ab (2 μg/ml) and then incubated with 50% human serum (HS) for 2h. In selected samples, S1-treated HMEC-1 were incubated with 50% HS in the presence of complement inhibitors (Compstatin, Comp; C3a receptor antagonist, C3aRa; C5a receptor antagonist, C5aRa). Platelet aggregate formation on HMEC-1 under flow conditions (60 dynes/cm2) was quantified and expressed as pixel2/field analysed. (D, E) Quantification (D) and representative images (E) of vWF deposition on HMEC-1 pre-exposed for 24h to medium alone (CTR) or S1 (10 nM) and then incubated with 50% HS in the presence or absence of complement inhibitors (Comp, C3aRa, and C5aRa). All experiments were repeated at least 3 times. Data represent mean ± SEM and were analysed with unpaired t-test or Tukey’s multiple comparison test, as appropriate. **p-value<0.01, and ***p-value<0.001 vs CTR; °p-value<0.05, °°p-value<0.01, and °°°p-value<0.001 vs 10 nM S1; ##p-value<0.01 and ###p-value<0.001 vs 10 nM S1+Irr. Scale bars 50 μm.
