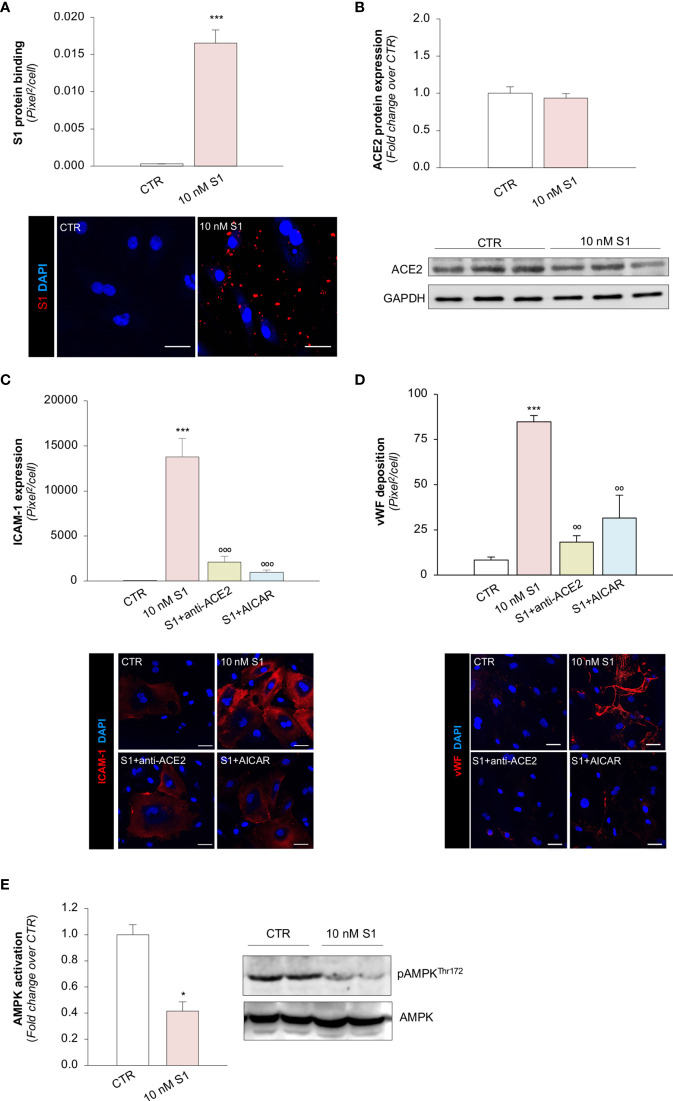
Figure 6.
S1, through ACE2, upregulates adhesive molecules on HPMEC by impairing AMPK signalling. (A) Quantification and representative images of the binding of the S1 protein (red) to HPMEC treated with medium alone (CTR) or S1 (10 nM) for 24 h. (B) Quantification and representative Western Blots of ACE2 protein expression in HPMEC exposed for 24h to medium alone (CTR) or S1 (10 nM). GAPDH was used as a sample loading control. (C, D) Quantification and representative images of ICAM-1 expression [(C), red], and vWF deposition [(D), red] on HPMEC incubated with medium alone (CTR) or with S1 (10 nM) in the presence or absence of anti-ACE2 Ab (2 μg/ml) or AICAR (2 mM). (E) Quantification and representative Western Blots of AMPK activation, evaluated as the ratio between the expression of pAMPKThr172 and total AMPK in HPMEC exposed for 24h to medium alone (CTR) or 10 nM S1. All experiments were repeated at least 3 times. Data represent mean ± SEM and were analysed with unpaired t-test or Tukey’s multiple comparison test, as appropriate. *p-value<0.05, and ***p-value<0.001 vs CTR; °°p-value<0.01, and °°°p-value<0.001 vs 10 nM S1. All slides were counterstained with DAPI (blue). Scale bar 50 μm.

