

Abstract
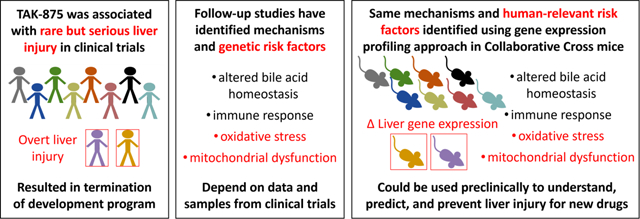
Development of TAK-875 was discontinued when a small number of serious drug-induced liver injury (DILI) cases were observed in Phase 3 clinical trials. Subsequent studies have identified hepatocellular oxidative stress, mitochondrial dysfunction, altered bile acid homeostasis, and immune response as mechanisms of TAK-875 DILI and the contribution of genetic risk factors in oxidative response and mitochondrial pathways to the toxicity susceptibility observed in patients. We tested the hypothesis that a novel preclinical approach based on gene pathway analysis in the livers of Collaborative Cross mice could be used to identify human-relevant mechanisms of toxicity and genetic risk factors at the level of the hepatocyte as reported in a human genome-wide association study. Eight (8) male mice (4 matched pairs) from each of 45 Collaborative Cross lines were treated with a single oral (gavage) dose of either vehicle or 600 mg/kg TAK-875. As expected, liver injury was not detected histologically and few changes in plasma biomarkers of hepatotoxicity were observed. However, gene expression profiling in the liver identified hundreds of transcripts responsive to TAK-875 treatment across all strains reflecting alterations in immune response and bile acid homeostasis and the interaction of treatment and strain reflecting oxidative stress and mitochondrial dysfunction. Fold-change expression values were then used to develop pathway-based phenotypes for genetic mapping which identified candidate risk factor genes for TAK-875 toxicity susceptibility at the level of the hepatocyte. Taken together, these findings support our hypothesis that a gene pathway-based approach using Collaborative Cross mice could inform sensitive strains, human-relevant mechanisms of toxicity, and genetic risk factors for TAK-875 DILI. This novel preclinical approach may be helpful in understanding, predicting, and ultimately preventing clinical DILI for other drugs.
Keywords: Collaborative Cross, drug-induced liver injury (DILI), mechanisms, TAK-875, toxicogenomics
Graphical Abstract
1. Introduction
TAK-875 (fasiglifam) is a selective G-protein-coupled receptor 40 agonist that was in development for the treatment of type 2 diabetes. During Phase 3 clinical trials, treatment with TAK-875 was associated with rare but serious incidents of drug-induced liver injury (DILI), leading to the discontinuation of the development of this compound (Marcinak et al., 2018). The pattern of liver injury observed was a delayed acute hepatocellular injury, characteristic of idiosyncratic DILI (IDILI). Subsequent mechanistic investigations using in vivo, in vitro, and in silico approaches have identified hepatocellular oxidative stress, mitochondrial dysfunction, bile acid accumulation, and immune response as factors contributing to TAK-875-induced liver injury in the clinic (Ackerson et al., 2019; Doerfler et al., 2021; Longo et al., 2019; Otieno et al., 2017; Urano et al., 2018; Wolenski et al., 2017). A recent analysis of GWAS data from TAK-875 clinical trials supports also genetic susceptibilities to DILI from this drug (Koido et al., 2020).
In the manuscript by Koido et al. (2020), the authors show significant overlap of variants associated with TAK-875 toxicity susceptibility and those that comprise a polygenic risk score (PRS) that was generated by aggregating the effects of numerous genetic variants associated with DILI due to multiple different drugs (Koido et al., 2020). Importantly, many of the PRS variants reside in hepatocyte-expressed genes and variants reflect enrichment of oxidative stress and mitochondrial pathways (Koido et al., 2020). The identification of genetic risk factors not only informs mechanisms of toxicity but can also be used for a precision medicine strategy to mitigate the risk of serious hepatotoxicity associated with the DILI-causing drug. However, human genetic studies can only be performed once a liver safety signal has emerged in clinical trials. It would be preferable to recognize safety liabilities, inform mechanisms, and identify genetic susceptibility factors for precision medicine risk mitigation prior to clinical studies.
Mouse genetic reference populations (GRPs) are a powerful preclinical tool that can be used to identify toxicity liabilities that are influenced by genetic risk factors (Chiu and Rusyn, 2018; Harrill and McAllister, 2017; Mosedale, 2018). Furthermore, sensitive and resistant strains can be used for follow up studies to inform the mechanisms of toxicity (Church et al., 2014; Mosedale et al., 2017; Mosedale et al., 2014). Finally, phenotypic data from a GRP can be utilized for quantitative trait loci (QTL) mapping to identify risk factors associated with drug-induced adverse events in target organs (Church et al., 2014; Harrill et al., 2012; Harrill et al., 2009; Mosedale et al., 2019; Mosedale et al., 2017; Mosedale et al., 2014). Therefore, a mouse GRP approach may be useful for predicting, understanding, and preventing IDILI like that associated with TAK-875.
To date, most GRP drug studies have focused on the use of traditional histological or serum biomarkers of necrosis to evaluate toxicity. In the case of IDILI-causing drugs like TAK-875, overt necrosis may not be observed until weeks or months after starting treatment and likely also involves an adaptive immune response that may not occur in animal models (Mosedale and Watkins, 2020). Furthermore, general adaptive responses in preclinical species can prevent the development of overt liver injury. For this reason, several groups have used liver gene expression profiling in animal models to detect the early activation of stress response pathways necessary to facilitate overt liver injury in humans (Laifenfeld et al., 2014; Leone et al., 2014; Monroe et al., 2020; Podtelezhnikov et al., 2020). An advantage of using a gene expression profiling approach in a mouse GRP is the ability to distinguish on-target and off-target treatment effects that occur broadly across the population from those that are highly heritable and may therefore be indicative of genetic susceptibility. Moreover, individual genes and gene pathways can be used for expression QTL (eQTL) mapping to identify genetic risk factors. Although we have reported the use of fold-change values for eQTL mapping with individual transcripts (Mosedale et al., 2017), and others have described eQTL mapping with pathways derived from single measurements of transcript levels (Keller et al., 2018), to our knowledge, no one has used transcript-fold change values to develop pathway-based phenotypes, which would be a preferred method for the identification of gene-by-treatment (GxT) effects.
In the present study, we tested the hypothesis that a gene pathway-based approach in a mouse GRP could be used to identify human-relevant mechanisms of toxicity and genetic risk factors at the level of the hepatocyte as reported in Koido et al. (2020). Specifically, we leveraged the Collaborative Cross (CC), a recently developed, high-diversity GRP (Collaborative_Cross_Consortium, 2012; Saul et al., 2019; Srivastava et al., 2017), and used a single high-dose exposure of TAK-875 to ensure robust gene expression changes in the liver in the absence of adaptation. Gene expression profiling in the liver was conducted in addition to the assessment of traditional biochemical and histological change and genetic mapping was then performed on all endpoints to identify genetic susceptibility factors associated with the TAK-875 response. We also developed a pathway-based approach based on fold-change in the gene expression response to enable the use of molecular phenotypes for genetic mapping GxT effects. Taken together, our results support the hypothesis that a gene pathway-based approach using CC mice could inform sensitive strains, human-relevant mechanisms of toxicity, and genetic risk factors for TAK-875 DILI. This novel preclinical approach may be helpful in understanding, predicting, and ultimately preventing clinical DILI for other drugs.
2. Materials and Methods
2.1. Animals
The CC is a panel of recombinant inbred lines derived from eight inbred founder mouse strains (short names in parentheses): 129S1/SvlmJ (129), A/J (AJ), C57BL/6J (B6), NOD/ShiLtJ (NOD), NZO/HlLtJ (NZO), CAST/EiJ (CAST), PWK/PhJ (PWK), and WSB/EiJ (WSB). The initiation of the CC breeding funnels, description of the CC lines, and animal housing are described elsewhere (Collaborative_Cross_Consortium, 2012). Eight (8) male mice from each of 45 CC lines (Supplementary Figure 1, x-axis) were purchased from the University of North Carolina, Chapel Hill. Care of the mice followed institutional guidelines under a protocol approved by the Mispro Institutional Animal Care and Use Committee and standards set forth by the Guide for the Care and Use of Laboratory Animals. Animals were acclimated for approximately 7 days prior to dosing. At the initiation of treatment, mice were approximately 8–10 weeks of age.
2.2. In-life procedures
2.2.1. Dose selection
An acute, high-dose exposure study design was selected to enable the use of liver gene expression profiling as an endpoint for the hepatotoxic response as previously described (Mosedale et al., 2017). This approach helps to maximize responses at the gene expression level while limiting the opportunity for adaptation (Laifenfeld et al., 2014; Leone et al., 2014). Within each CC line, 4 animals were treated with a single dose of vehicle (0.5% w/v methylcellulose in purified water) and 4 were treated with TAK-875 (600 mg/kg). The human equivalent dose of 600 mg/kg is ~15-fold higher than the clinically relevant dose of 200 mg (Naik et al., 2012) and was expected to be a maximum tolerated dose in the more sensitive strains of the CC based on previous studies conducted in B6C3F1/CRLj mice (unpublished internal data, Takeda).
2.2.2. Dosing
Test and control articles were administered by oral gavage in a dosing volume of 10 ml/kg. Vehicle- and TAK-875-treated animals within each line were treated in pairs, and pairs within each line were randomized over the course of the study to minimize batch (treatment group) effects. Animals were assigned to treatment groups using a randomization method based on bodyweight. Half of the strains started the study with the heavier animal in the first pair getting vehicle and the lighter animal getting TAK-875 and alternating this convention until all four pairs were dosed and other half started with the heavier animal in the first pair getting TAK-875 and the lighter animal getting vehicle and alternating this convention until all four pairs were dosed.
2.2.3. Interim blood draw
Animals were food fasted 12 h prior to dosing and continued fasting until after the 6 h post-dosing blood draw to control for food effects on exposure and bile acid levels. Approximately 100 μl of whole blood from each mouse was collected via puncture of the submandibular (facial) vein at 6 h post-dosing. The blood was transferred to a tube containing K2EDTA and centrifuged at 1300 × g and 4°C for 10 minutes to pellet red blood cells. Approximately 25 μl of plasma (TAK-875-treated animals only) was removed for analysis of drug concentration. Remaining supernatant (from all animals) was transferred to a clean microcentrifuge tube and centrifuged at 16000 × g and 4°C for 10 min to pellet mitochondria for clinical chemistry analyses. Clinical assessments were performed at dosing, blood draw, and necropsy using previously described methods (Burkholder et al., 2012).
2.3. Necropsy
Animals were sacrificed 24 h post-dosing by CO2 inhalation followed by cardiac exsanguination. Blood was collected by cardiac puncture, transferred into a microcentrifuge tube containing K2EDTA, and processed as described previously. The liver of each animal was removed, and gross observations and liver weights recorded. A section of the left and median liver lobes was fixed in 10% neutral buffered formalin and processed for histological analysis. A section of liver tissue encompassing all regions of the median lobe was finely diced, placed in RNAlater, and processed for RNA isolation.
2.4. Plasma drug concentration
Plasma TAK-875 (parent only) concentration was analyzed as previously described using a qualified liquid chromatography with tandem mass spectrometry (LC/MS/MS) method (Wolenski et al., 2017).
2.5. Clinical chemistry
Interim and terminal plasma levels of total bile acid (TBA) were determined using the Diazyme Total Bile Acids Assay with a modified protocol corresponding to the Crystal Chem Total Bile Acids Kit. The assay was performed using a SpectraMax microtiter plate reader (Molecular Devices). Terminal plasma levels of total bilirubin (TBIL) were also measured on a SpectraMax microtiter plate reader using the Carolina Chemistries Total Bilirubin Reagent. Terminal plasma levels of alanine aminotransferase (ALT), aspartate aminotransferase (AST), and glutamate dehydrogenase (GLDH), were assessed using standard assays on a CLC 720 clinical chemistry analyzer (Carolina Liquid Chemistries). Terminal plasma levels of microRNA-122 (miR-122) were assayed by qPCR using methods previously described (Mosedale et al., 2017).
2.6. Histology
Formalin-fixed liver tissue was paraffin-embedded, cut into 5-μm sections and stained with hematoxylin and eosin (H&E). H&E stained slides were microscopically examined and scored by a Board-Certified Veterinary Pathologist (Charles River Laboratories, Pathology Associates).
2.7. RNA isolation and microarray processing
Total RNA was isolated from the median lobe of the liver of all animals except the two that died before necropsy. RNA was isolated using Trizol reagent (Invitrogen) according to manufacturer’s instructions. The isolated RNA was further purified using the QIAcube automated system (Qiagen). Following purification, the quantity of RNA was determined spectrophotometrically and the integrity of the RNA was evaluated with the Agilent 2100 Bioanalyzer. Double-stranded cDNA was synthesized from 50–150 ng (dependent on RNA yield) of total RNA, then transcribed to biotin-labeled cRNA using the 3’ Express IVT kit (Affymetrix). Fifteen micrograms of labeled cRNA was fragmented and prepared for hybridization on HT MG430 PM peg arrays. The Gene Titan robotic instrumentation (Affymetrix) was used to perform the hybridization, washing and scanning of the peg arrays.
2.8. Animals excluded from phenotypic analysis
Two (2) TAK-875-treated animals (strains CC065/Unc and CC053/Unc) died prematurely during the study and were excluded from the analysis of all terminal endpoints. Both deaths occurred shortly after the interim blood draw. No gross findings in the liver were reported, and no liver lesions were observed during histological examination that could account for the early deaths in these animals. The corresponding vehicle-treated animals were also excluded from paired analysis. No drug was detected in the blood of 2 TAK-875-treated animals: (lines CC006/Unc and CC044/Unc). While TAK-875 concentrations were not measured in vehicle-treated animals, it was suspected that vehicle- and TAK-875 treatments may have been switched in these pairs. These animals and their corresponding vehicle-treated controls were excluded from all analyses. Insufficient sample volume, assay interference, or values below the limit of quantitation resulted in the inability to obtain terminal endpoint values from other animals as noted. Corresponding vehicle- or TAK-875-treated animals within those strain pairs were also excluded from the affected analysis.
2.9. Gene expression analysis
All animals in CC016/GeniUnc and 1 TAK-875 treated animal in CC042/GeniUnc were flagged as phenotypic outliers due to, respectively, extremely low and highly divergent drug concentrations (Supplementary Figure 1) and were thus excluded from subsequent analysis. To avoid confounding from genetic variation (Keane et al., 2011), probes containing any SNPs in the genome of 45 CC strains were masked using the “kill-list” option in the APT module “apt-probeset-summarize”. Affymetrix CEL files were normalized using the Robust Multi-array Average (RMA) method with log2 transformation (Irizarry et al., 2003) implemented in Affymetrix Power Tools (APT, v 1.17.0). A second pre-filtering step was then performed to eliminate lowly expressed probe sets defined as the maximum of log2 transformed expression level across samples less than an empirically chosen cutoff. Principal component analysis (PCA) and hierarchical clustering was used to evaluate the overall performance of the arrays. Seven (7) animals were identified as outliers (strains CC004, CC010, CC023, CC027, CC028, CC042, CC053, one animal each strain). These animals and their pairs were removed from all subsequent analysis. Gene expression data generated for this manuscript can be downloaded in its entirety from the Gene Expression Omnibus repository under the accession number GSE152852 (which can be accessed by reviewers in advance of publication using the secure token: mtcdoyoertorbef). All data are MIAME compliant.
2.10. Statistical Analysis of Livery Injury Biomarkers
TAK-875 response phenotypes have been deposited in the Dryad Digital Repository and can be downloaded at https://datadryad.org/stash/dataset/doi:10.5061/dryad.9s4mw6mdz. (which can be accessed by reviewers in advance of publication using the link https://datadryad.org/stash/share/8o1LTdmRQUm5HcK8W5PNaSsOFxr0mFUzGdHb3kqxcN4)
2.10.1. Defining TAK-875 response in terms of experimentally matched pairs
For a given liver injury biomarker, TAK-875 response was defined as an adjusted difference in measured value between experimentally matched drug-treated and vehicle-treated pairs. Let si denote the ith matched pair of strain s, with this pair comprising TAK-875 treated mouse si1 and vehicle-treated mouse si0. Denote the observed values of the phenotype for si1 and si0 as ysi1 and ysi0 respectively. The raw TAK-875 response for pair si was defined as
| (Eq 1) |
where t is a normalizing transformation, in this case t=loge for all outcomes, such that measures the log fold change between the two paired mice. The raw TAK-875 responses were then adjusted for any effects of drug concentration and batch as follows. Let concsi1 be the concentration of TAK-875 in drug-treated mouse si1 corrected for the mean of those concentrations across all drug-treated mice, let b=1,…,9 index the nine batches of the experiment (corresponding to dosing dates), and b[si] denote the dosing date relevant to pair si. We fitted the linear mixed model,
| (Eq 2) |
where μ is an intercept, βconc is the effect of drug concentration, batchb[si] is a random effect of batch, ie, , where is the batch variance, is a random effect of strain, where is strain variance, and εsi ∼ N(0, σ2) is residual error, with σ2 the residual variance. From this fitted model, we defined the (adjusted) TAK-875 response as,
| (Eq 3) |
where and are respectively the least squares and shrinkage estimates of the drug concentration and dosing date. The resulting Δis approximates the TAK-875 response in the case where all drug-treated mice have a drug concentration equal to the average of that actually observed. It is these values that are carried forward into subsequent analyses.
Estimating overall effect of TAK-875 treatment and G × T heritability
For each phenotype, we estimated two primary quantities: the overall response to TAK-875 across all 45 CC strains (treatment effect), and the degree to which TAK-875 response varied by strain (G × T heritability, or ). This was done by fitting a linear mixed model to the TAK-875 response,
| (Eq 4) |
where the intercept μ estimates the treatment effect, and random effect of strain and error defined as in Eq 2, with variances respectively and σ2. The G × T heritability was defined as , the proportion of variance in TAK-875 response explained by strain. We note that heritability estimates are in general imprecise and that our reported point estimates for should be assumed to have wide confidence intervals. Linear mixed models were fitted using the R package lmer (Bates et al., 2015). P-values for treatment effect μ were calculated using the t-test with Satterthwaite approximations to the degrees of freedom using R package lmerTest (Bates et al., 2015); p-values for were calculated using a permutation test, after Fitzmaurice et al. (2007). Within each type of test, p-values across liver injury biomarkers were subject to multiple test correction using the Benjamini-Hochberg False Discovery Rate (FDR) (Benjamini and Hochberg, 1995). Heritability of TAK-875 concentration, which we do not as such consider a true G × T heritability, was estimated as above but using the batch-corrected t(ysi) in place of Δis in Eq 4. (h2=0.242, and P-value<0.001).
2.10.2. Genotype and Haplotype Reconstruction of the CC mice
The genome of each CC strain comprises a mosaic of segments, or haplotypes, inherited from the 8 CC founders. Thus, genotyping data can be used to infer the underlying haplotype mosaic, which is then used in the detection of QTL. Prior to the study, genotyping information had been collected from each strain using MegaMUGA, a custom 78K-marker array built on the Illumina Infinium genotyping platform, designed to support the CC, and optimized to both identify founder contributions and detect any residual heterozygosity (Morgan and Welsh, 2015). Probe intensities from MegaMUGA had then been converted using a hidden Markov model (HMM) (Fu et al., 2012) into a probabilistic representation of the haplotype mosaic: for each strain at each genotyped locus, the HMM calculates the probability of having inherited each of the possible haplotype pairings (diplotype), giving rise to 36 diplotype probabilities. The diplotype probabilities for the CC lines used in our study experiments, which had been calculated previously, were downloaded from the UNC Systems Genetics website: http://csbio.unc.edu/CCstatus/index.py. The 76K reported markers were reduced to 7,641 genome segments for faster analyses and reduction of genotyping errors by averaging the probability matrices of 10 markers to create a new matrix for each segment. Genome scans were comparable using 76K markers versus 7,641 segments, supporting the averaging across markers. Genomic locations in genome scan were reported using NCBI mouse genome build 38.
2.10.3. Quantitative Trait Loci Mapping
QTL mapping of liver injury biomarkers was performed by testing the association between TAK-875 response and the inherited founder haplotypes at each point in the genome, as described in (2019). In brief, genetic association was tested by fitting at each genomic locus a linear model for the strain mean of TAK-875 response that included a QTL effect based on the haplotype reconstruction of each locus, and then comparing the fit of this QTL model with that of a null model with the QTL effect omitted. In each case, the linear model included observation weights to account for different numbers of individuals per strain. Comparison of the QTL with the null model produced association scores across the genome (genome scans) for which genome-wide significance thresholds were then calculated. In more detail, let Δs denote the mean of TAK-875 response Δsi for all ns pairs in strain s. The null model was defined as
| (Eq 5) |
where the intercept μ estimates treatment effect and residual error is modeled as a random effect εs ∼ N(0, σ2/ns), where ns is the number of pairs in strain s. Note that the CC strains are, by construction, approximately equally related, making further effects such as polygenic or population structure effects unnecessary (Keele et al., 2019). Note also that a covariate for body weight was not included since weights between each pair were similar by design. The alternative model for locus m on TAK-875 response Δs was equivalent to the null model with an additional term,
| (Eq 6) |
where the QTL contribution QTLsm represents the sum of the effects of the founder haplotypes, weighted by haplotype count for individual i at locus m. For strain s this quantity is defined as
| (Eq 7) |
where, for example, βAJ,m is the effect of the AJ haplotype on TAK-875 response, and xAJ,sm is the number of founder AJ haplotypes present at locus m in CC strain s. However, since the haplotype counts xAJ,sm,…,xWSB,sm are not observed directly, being approximated only via the diplotype probabilities and therefore subject to uncertainty, QTLsm was modeled using the multiple imputation (MI) method that accounts for haplotype uncertainty described in Mosedale et al. (2017). Genome-wide significance thresholds were calculated using a permutation procedure designed to control family-wide error rate (FWER). At each permutation, the genome scanning procedure described above was repeated but with the genome information of strains 1,2,…,44,45 having been reassigned to a random reordering of those strains, e.g., 28,41,…,13,7; from this genome scan, the maximum −log10(p) was then recorded. We performed 10,000 permutations in all. The maximum −log10(p) values for all permutations were used to fit a generalized extreme value distribution (GEV) (Dudbridge and Koeleman, 2004; Valdar et al., 2006). The GEV has three parameters, shape ξ, location μ, and scale σ; permutation-based estimates of these parameters were used to determine the theoretical upper α quantile that was then taken as the α-level genome-wide significance threshold.
2.11. Statistical Analysis of Gene Expression
2.11.1. Identifying genes and pathways with significant effect of TAK-875 treatment and G × T heritability
The treatment effect of TAK-875 and G × T heritability were estimated for each probe set as for liver injury phenotypes above. In this case, the treatment effect corresponds to an overall log fold change in expression, with describing the deviation from that effect explained by strain. For a given test, for treatment effect or , P-values were across all probe sets were subject to multiple test correction by FDR, with FDR q-values of less than 0.05 considered significant. Probe sets were categorized into three classes: those with both significant treatment effect and significant , those with significant treatment effect only, and those with significant only. Gene lists have been deposited in the Dryad Digital Repository and can be downloaded at https://datadryad.org/stash/dataset/doi:10.5061/dryad.9s4mw6mdz. (which can be accessed by reviewers in advance of publication using the link https://datadryad.org/stash/share/8o1LTdmRQUm5HcK8W5PNaSsOFxr0mFUzGdHb3kqxcN4)
The list of probe sets in each class was subject to pathway enrichment analysis using the Tox Analysis module in Ingenuity Pathway Analysis (Ingenuity Systems; Build version: exported; Content version: 48207413). Results of Ingenuity Pathway Analysis were similar to the enriched functional annotations identified using the Database for Annotation, Visualization and Integrated Discovery (DAVID; version 6.8 with default settings) (Huang da et al., 2009a, b). Functional annotation clustering results from the DAVID analyses have been deposited in the Dryad Digital Repository and can be downloaded at https://datadryad.org/stash/dataset/doi:10.5061/dryad.9s4mw6mdz. (which can be accessed by reviewers in advance of publication using the link https://datadryad.org/stash/share/8o1LTdmRQUm5HcK8W5PNaSsOFxr0mFUzGdHb3kqxcN4).
2.11.2. Quantitative Trait Locus Mapping of Expression Data
For expression data, QTL mapping proceeded as for livery injury biomarkers above, except that that strain means were subject to a rank-based inverse normal (RINT) transformation prior to haplotype association. That is, Δs in Eq 5 was replaced by RINT(Δs), where RINT(x) = Φ−1[(rank(x)−0.5)/n] and Φ() is the normal cumulative distribution function, ie, the sample Δs quantiles are replaced by quantiles from the standard normal distribution. This was done to ensured the phenotype was distributed normally, albeit at a slight potential loss of power, and computational efficiency (see later). With the transformed input, the same MI permutation process was applied to estimate genome-wide significance. Since the distribution of rint(Δs) is (ignoring ordering) identical across probe sets, the permutation-derived null distribution for all probe sets is the same. Thus, genome-wide significance was determined for a single transcript and this was applied to all other probe sets. To control for multiple testing across all probe sets, genome-wide corrected p-values were further subject to FDR. The highest peak for each probe set is recorded as candidate eQTLs.
2.11.3. Pathway-Based Gene Expression Analysis and Robustness Testing
Weighted gene co-expression network analysis (WGCNA) was performed using strain averages for TAK-875-induced fold change in gene expression (Zhang and Horvath, 2005). WCGNA identifies clusters (modules) of correlated genes that are presumed to reflect densely interacting gene subnetworks. (We used WCGNA version 1.66 with the automatic network construction and module detection pipeline, which sets power=6, minModuleSize=15, mergeCutHeight = 0.15.) To see if the modules identified had distinct genetic drivers, the eigengene values of each module (the first principal component of that module’s genes) were used as a phenotypic input for QTL mapping. Eigengene QTL mapping results underwent a similar Benjamini-Hochberg False Discover Rate (FDR) process as eQTL mapping.
The assignment of genes to modules, along with module size and order, can be sensitive to minor changes in the input data or WCGNA parameter settings. To remove these “brittle” models from future analysis and thereby focus on those that are more likely to reflect real biological pathways and interactions, we performed a sensitivity analysis, re-running WCGNA on perturbed versions of the data and analyzing the variation in the output, specifically, which modules were consistently identified and gave rise to consistent QTLs. In more detail, we generated 45 alternate versions of the input data, each one omitting transcript data from a different strain (ie, usually 8 animals). This procedure termed leave-one-strain-out or LOSO is similar in spirit to jackknifing and “stability selection”-type approaches used previously (Poitou et al., 2015; Shannon et al., 2016). WCGNA was then rerun on each LOSO dataset using the same settings as before, and the output modules recorded, along with their eigengene values and eigengene mapping results. The output modules from WCGNA differ for every dataset, and so the modules from a given LOSO dataset will typically not correspond to those from the original data set exactly. Therefore, each LOSO dataset’s modules were matched to those of original dataset based on gene list overlap. For example, when comparing the original dataset modules with those from the first LOSO dataset, original data module ME1 might be most similar to LOSO module ME7LOSO.1 with, say, 96% of genes in ME1 present in ME7LOSO.1, in which case, ME7LOSO.1 would be considered to represent the original data module ME1; in the second LOSO dataset, the best matching module might be ME4LOSO.2 with overlap 87%, so it would be ME1’s representative in this case, and so on. The robustness of a given module in terms of gene list definition was measured as the average of the overlap percentage of its representatives across all LOSO datasets (LOSO Gene List Overlap). The robustness of a given module in terms of its inferred genetic regulation was assessed based on the significance and location of its representatives’ QTL peaks. Let qk and lk denote the FDR q-value and location respectively of the top QTL peak of the best match module in the kth LOSO dataset. The “LOSO Average q” metric was defined as the geometric mean of q1,…,q45; the “LOSO Same Peak” metric was defined as the fraction of l1,…, l45 that are within 5Mb of the highest QTL peak of the observed module. These metrics were used to prioritize for further analysis observed modules with consistent gene list composition and eigengene mapping performance.
TAK-875 eQTL mapping results have been deposited in the Dryad Digital Repository and can be downloaded at https://datadryad.org/stash/dataset/doi:10.5061/dryad.9s4mw6mdz (which can be accessed by reviewers in advance of publication using the link https://datadryad.org/stash/share/8o1LTdmRQUm5HcK8W5PNaSsOFxr0mFUzGdHb3kqxcN4)
2.11.4. Haplotype Effects at Detected Loci and Confidence Intervals for Location
For detected QTL, the effect of alternate haplotype substitutions on drug response was estimated using the Diploffect model of Zhang et al. (2014). This is a Bayesian linear mixed model that provides confidence intervals (as highest posterior density intervals) both for additive (haplotype) effects and dominance (heterozygous diplotype) effects, incorporating any uncertainty in the haplotype assignments from the HMM. Confidence intervals for the location of detected QTL were defined using positional bootstrapping after Visscher et al. (1996), as previously described by (Phillippi et al., 2014; Woods et al., 2012). To provide estimates that are computationally stable, 1000 nonparametric bootstraps were performed for each phenotype to obtain a distribution of highest peak positions and the 80% confidence interval was reported as the narrowest interval that covers 80% of the bootstrap highest peaks.
2.11.5. Fine Mapping of Eigengene QTL using Multiallelic Merge Analysis
Candidate variants were prioritized within detected QTL and subsequent quantitative trait genes (QTGs) where the variants reside using multiallelic merge analysis (Phillippi et al., 2014; Vered et al., 2014; Yalcin et al., 2005), which compares the significance of association for individual variants obtained from the haplotype model used for genome-wide analysis with those obtained using a genotype model, where the founder strain haplotypes are “merged” into fewer than 8 groups according to their genotype, for example, 2 groups for each biallelic SNP analysis (Phillippi et al., 2014; Vered et al., 2014; Yalcin et al., 2005), or 3 or more groups for multiallelic variants such as copy number variants (Mosedale et al., 2019; Mosedale et al., 2017). The allocation of alleles to haplotypes in this case is termed the strain distribution pattern (SDP), with for example 00111222 denoting a triallelic variant with distinct alleles for the groups (B6,129), (AJ,NOD,NZO), and (CAST,PWK,WSB). For potentially causative variants, both haplotype model and “merged” model will explain a significant portion of the variation, but the variant-based model will do so with far fewer parameters, providing a more parsimonious fit and more significant p-value. To perform a merge analysis on segregating SNPs within the 80% CI of significant QTL, CC genotype information is drawn from the Inbred Strain Variant database (Oreper et al., 2017) which is imputed from whole-genome sequencing data (release 1504) downloaded from the Wellcome Trust Sanger Institute’s Mouse Genomes Project (http://www.sanger.ac.uk/resources/mouse/genomes/). At each variant within the 80% CI, p-values from the merged model were compared with those from the 8-allele haplotype model; greater significance of the merged model provided evidence in support of variant underlying the detected QTL signal. Since many individual variants within a small region are indistinguishable due to the combination of close linkage and identical SDPs, it will often be the case that the top scoring significance is shared by several SNPs of the same SDP.
3. Results
3.1. Plasma TAK-875 concentrations vary among Collaborative Cross mice
Plasma TAK-875 concentrations were measured 6-h post dose, the approximate time of peak plasma concentrations (Tmax) in mice (unpublished internal data, Takeda). Although TAK-875 dose was adjusted for bodyweight, the average plasma concentration of TAK-875 was highly heritable, indicating TAK-875 concentrations are driven by genetics (Supplementary Figure 1). Median concentrations were lower than plasma concentrations observed 6-h post dose in previous studies conducted in B6C3F1/CRLj mice (unpublished internal data, Takeda), but still ~10-fold higher than peak plasma concentrations (Cmax) concentrations observed in humans at the clinically relevant dose of 200 mg (Naik et al., 2012). Despite significant heritability (h2=0.242, p=0.001), no significant QTLs were identified for TAK-875 plasma concentrations measured in this study.
3.2. TAK-875 induces few changes in biomarkers of liver injury in Collaborative Cross mice
The single dose of TAK-875 caused clinical findings across many strains that consisted mainly of dehydration, hunched posture, lethargy, and hypothermia. Microscopic analysis of the liver, however, indicated that TAK-875 did not cause overt hepatotoxicity (i.e., substantial hepatocyte necrosis), and this was confirmed by the lack of a significant TAK-875 treatment effect (corrected for TAK-875 plasma concentration) on most plasma biomarkers of hepatotoxicity (Table 1). The treatment effect was only significant for interim TBA, which along with TAK-875-induced fold change in miR-122 had significant GxT heritability (Table 1). However, no significant QTLs were identified for these fold change phenotypes or any of the plasma biomarkers measured in this study (Supplementary Table 1).
Table 1.
Treatment and Strain-by-Treatment (GxT) Effects for Toxicity Biomarkers
| Phenotype | Treatment q-value | Treatment Fold Change | GxT Heritability q-value | GxT Heritability |
|---|---|---|---|---|
|
| ||||
| TBA6h* | 0.001 | 15.12 | 0.012 | 0.189 |
| TBA | 0.064 | 1.21 | 0.810 | 0.000 |
| ALT | 0.024 | 1.15 | 0.034 | 0.151 |
| AST | 0.173 | 1.09 | 0.810 | 0.002 |
| TBIL | 0.323 | 0.96 | 0.864 | 0.000 |
| miR-122* | 0.323 | 1.15 | 0.006 | 0.252 |
FDR q-value and descriptive statistics for log-transformed fold change compared to paired control values (corrected for TAK-875 plasma concentration) for plasma total bile acids at 6 h post dose (TBA6h) and alanine aminotransferase (ALT), aspartate aminotransferase (AST), total bilirubin (TBIL), microRNA-122 (miR-122), and total bile acids (TBA) at 24 h post dose.
Indicates statistically significant as determined by q-value<0.05 and |FC|>1.2 or GxT heritability>0.18.
3.3. Gene expression changes reflecting alterations in immune response and bile acid homeostasis are associated with TAK-875 treatment across all strains but alterations in oxidative stress and mitochondrial dysfunction are strain dependent
Microarray profiling of liver RNA was used to identify gene expression changes associated with TAK-875 treatment and the interaction of treatment and strain as determined by heritability of the fold change response (GxT heritability) (Figure 1). A total of 330 probe sets were significantly associated with TAK-875 treatment but without significant GxT heritability (red transcripts); 2044 probe sets showed significant GxT heritability but without a significant treatment effect (blue transcripts); and 137 probe sets showed both a significant effect of treatment and significant GxT heritability (purple transcripts). Pathway enrichment analysis was then performed on these gene lists to understand treatment effects that occur independently of genetic background (red) vs. those that are dependent on, or modified by genetics (blue and purple). Pathways associated with cholesterol metabolism were the most significantly enriched among all “red transcripts” and among those exclusively upregulated in response to TAK-875 treatment, while pathways reflecting altered immune function and bile acid homeostasis were some of the most significantly enriched among genes decreased in response to TAK-875 treatment (Figure 2). Pathways associated with oxidative stress and mitochondrial dysfunction were significantly enriched among “blue and purple transcripts” affected by TAK-875 treatment differently across CC strains (Figure 3). We also identified transcriptional changes correlated with the fold change in plasma biomarkers (Supplementary Table 2). Phenotypes with >100 significant probe sets were then used for pathway enrichment, and similar findings were observed (Supplementary Figures 2–4).
Figure 1.
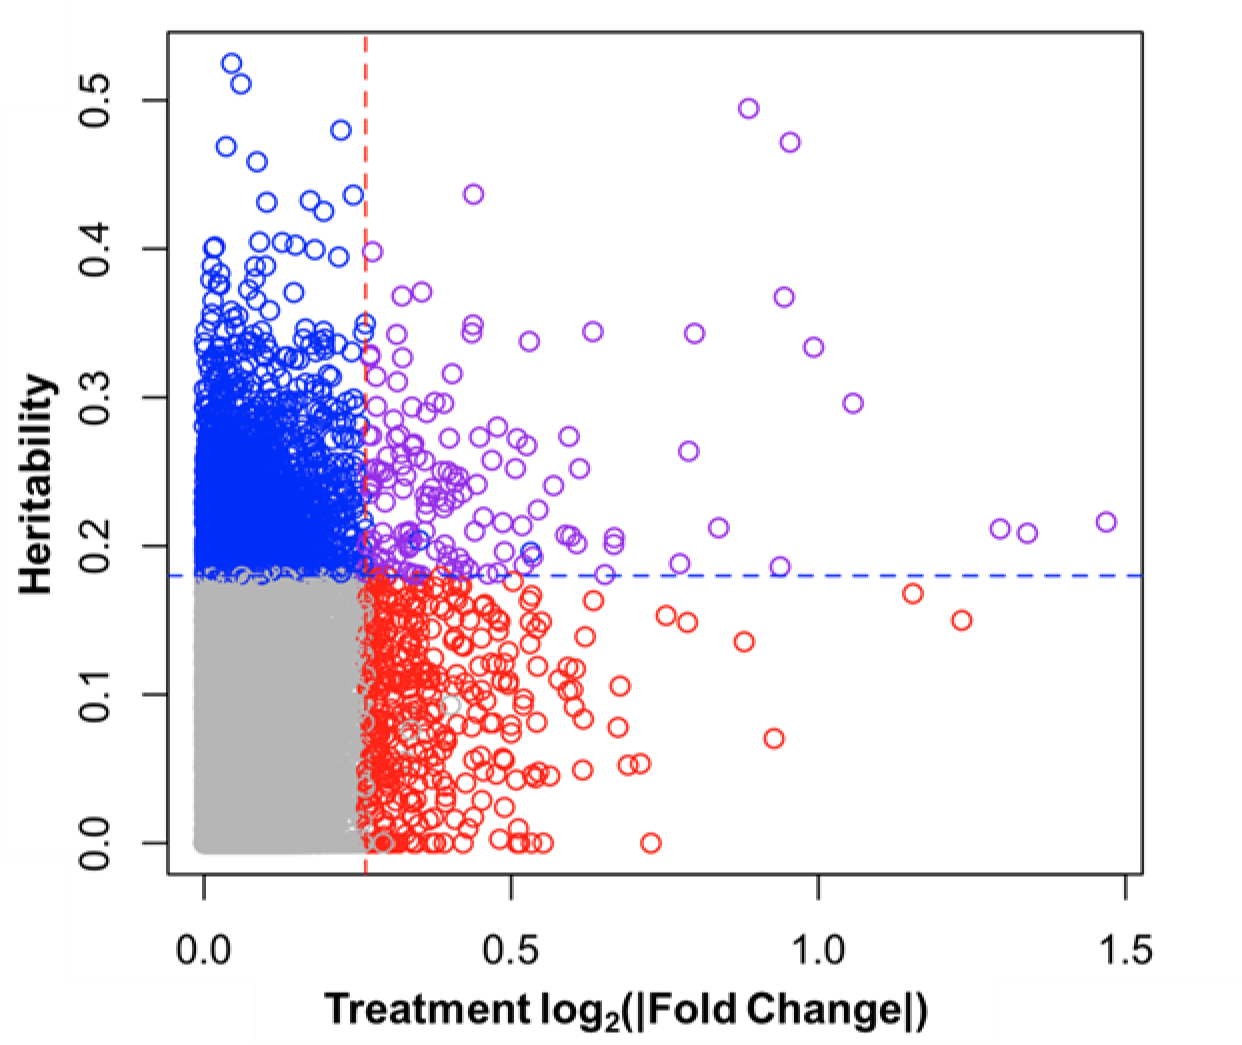
Probe sets plotted by GxT heritability and fold change in response to TAK-875 treatment. Dotted lines indicate significance cutoffs of log2(|FC|)>0.263 (equal to |FC|>1.2) or heritability>0.18 and are colored red when FDR q-value<0.05 for treatment but not heritability, blue when FDR q-value<0.05 for heritability but not treatment, and purple with FDR q-value<0.05 for both treatment and heritability.
Figure 2.
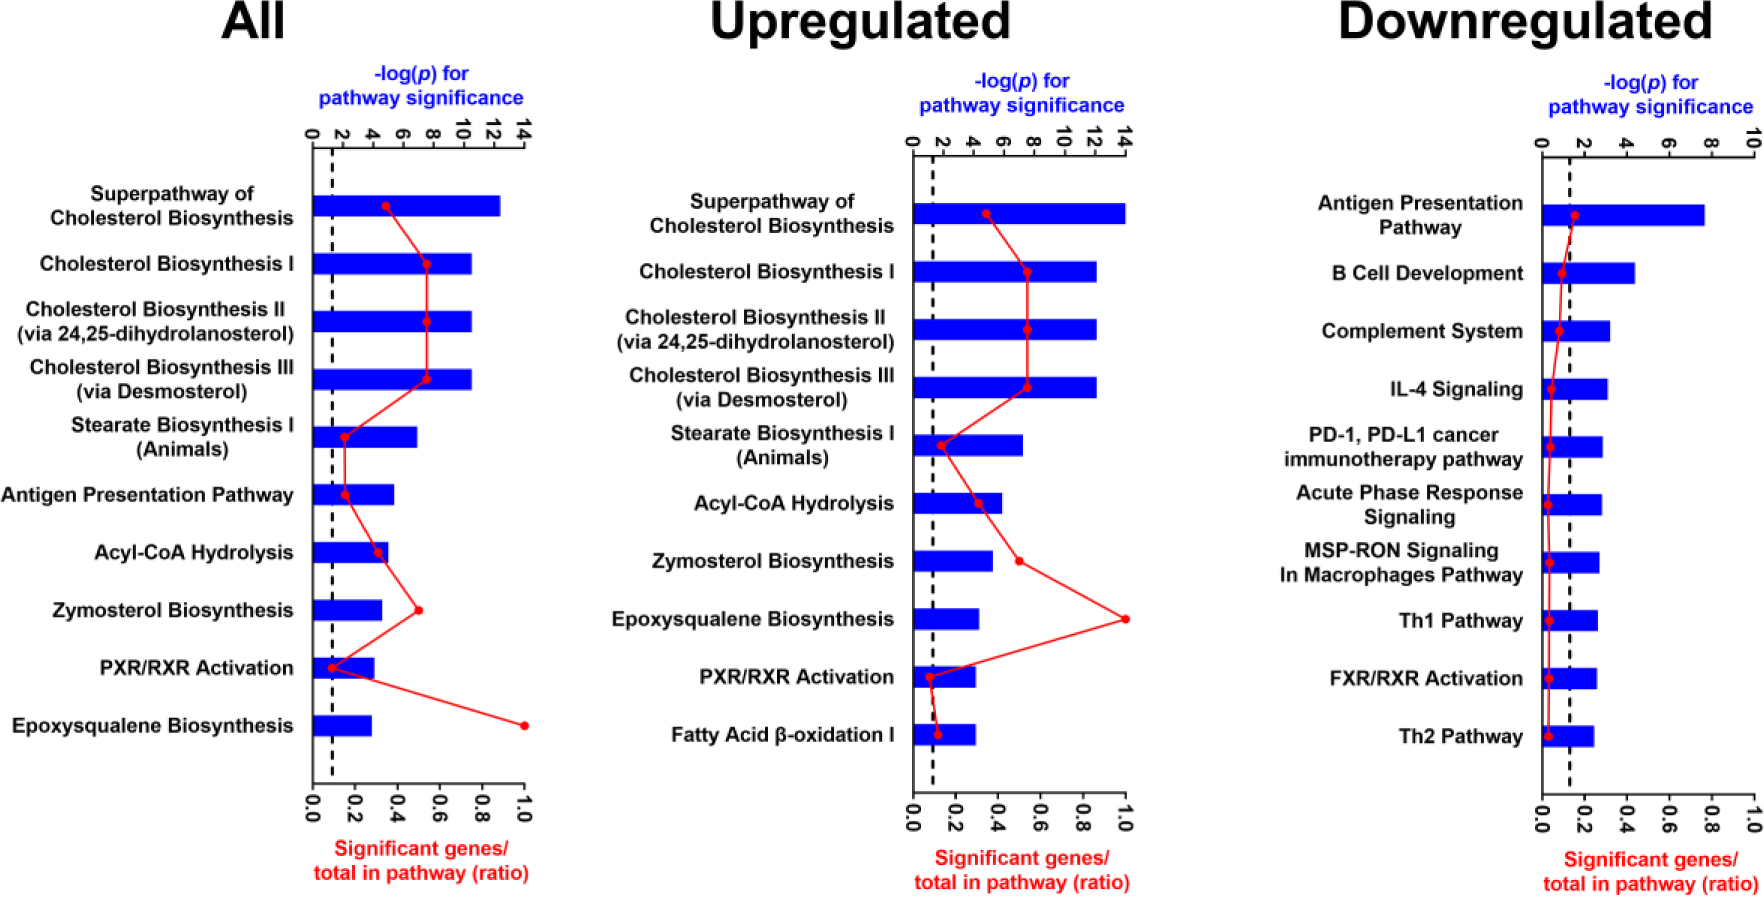
The top 10 pathways enriched among all probe sets, those upregulated, and those downregulated in response to TAK-875 but not significant for GxT heritability (red in Figure 1). Pathway significance is plotted by −log10(p) on the top axis and represented by the blue bars on the graphs. The dashed line indicates a −log10(p)>1.3 threshold for significance. The ratio of significant genes relative to the total genes in the pathway is plotted on the bottom axis and represented by the red dots (connected by a red line) on the graphs.
Figure 3.

Top 10 pathways enriched among probe sets with significantly TAK-875 GxT heritability (blue and purple in Figure 1). Pathway significance is plotted by −log10(p) on the top axis and represented by the blue bars on the graphs. The dashed line indicates a −log10(p)>1.3 threshold for significance. The ratio of significant genes relative to the total genes in the pathway is plotted on the bottom axis and represented by the red dots (connected by a red line) on the graphs.
3.4. Expression quantitative trait loci mapping identifies quantitative trait genes that may underlie toxicity susceptibility
To identify additional treatment-induced molecular phenotypes driven by genetic variation, which may in turn contribute to TAK-875-toxicity susceptibility, we performed eQTL mapping of both individual expression values and expression fold change. As expected, mapping with individual expression data from vehicle- and TAK-875-treated mice identified thousands of significant eQTLs with >75% overlap among local eQTLs between the two groups (Supplementary Figure 6). More importantly, however, mapping with fold change in gene expression levels between pairs of TAK-875- and vehicle-treated mice identified 3 significant GxT eQTLs, of which thioredoxin (Txn1) was identified as a priority transcript based on the existence of a human orthologue, liver expression, and biological relevance (Table 2). Founder strain and merge analysis were used to identify 30 candidate QTGs for the Txn1 eQTL (Supplementary Figure 6).
Table 2.
Significant Gene-by-Treatment Expression QTLs
| Gene Symbol | Gene Name | Human Orthologue | Human Liver Expression | Biological Relevance |
|---|---|---|---|---|
|
| ||||
| Tmem198b | Transmembrane Protein 198B | - | NA | NA |
| Exph5 | Exophilin 5 | EXPH5 | + | - |
| Txn1* | Thioredoxin 1 | TXN | + | + |
GxT eQTLs significant at the q<0.1 level. Regression with TAK concentration shows similar mapping results, indicating that exposures is not a contributing factor.
NA=not applicable.
Indicates priority transcript identified based on meeting all three criteria: human orthologue, liver expression, and biological relevance.
3.5. A pathway-based approach to expression quantitative trait loci mapping identifies additional TAK-875-induced phenotypes and quantitative trait genes that may underlie toxicity susceptibility
A pathway-based approach to eQTL mapping was then used to identify novel molecular phenotypes and associated loci that may contribute to TAK-875-toxicity susceptibility. Pathway analysis for eQTL mapping was performed using WGCNA (Zhang and Horvath, 2005). Unlike Ingenuity Pathway Analysis, which looks for the enrichment of predefined gene pathways among a list of transcripts meeting specific criteria (e.g. differential expression), WGCNA uses all the analyzed transcripts to empirically identify clusters (modules) of highly correlated genes which can be summarized using a module eigengene value and employed as a phenotypic input for QTL mapping as previously described (Keller et al., 2018). In this study, however, we used TAK-875-induced fold change in gene expression values to look at a true GxT effect. WGCNA identified 23 modules among TAK-875-induced gene expression changes across the CC strains, and mapping using the module eigen gene values resulted in 2 significant and robust eQTLs: ME7 and ME9 (Supplementary Table 3). Ingenuity Pathway Analysis was then used to inform the molecular phenotype(s) represented by the genes in each module. Pathways associated with macrophage activation and immune signaling were the most significantly enriched among the 182 genes in ME7 (Figure 4A). Pathways associated with mitochondrial dysfunction and oxidative stress were the most significantly enriched among the 131 genes in ME9 (Figure 4B).
Figure 4.

The top 10 pathways enriched among (A) module 7 probe sets and (B) module 9 probe sets are shown. Pathway significance is plotted by −log10(p) on the top axis and represented by the blue bars on the graphs. The dashed line indicates a −log10(p)>1.3 threshold for significance. The ratio of significant genes relative to the total genes in the pathway is plotted on the bottom axis and represented by the red dots (connected by a red line) on the graphs.
The QTL associated with the ME7 eigengene gene values is on chromosome 3 (Figure 5A). Founder probabilities at the QTL peak show four strains with 129 DNA that have lower ME7 eigengene values (Figure 5B). Bayesian modeling of the QTL haplotype effects correspondingly estimated a strong negative effect of the 129 haplotype on ME7 eigengene values (Figure 5C). The ME7 eigengene value QTL was mapped to an 80% confidence interval of 20.65–143.69 Mb (Figure 5D). Merge analysis was used to identify QTGs in the region that may explain the differences in ME7 eigengene values as previously described (Mosedale et al., 2019; Mosedale et al., 2017). In the ME7 eigengene value QTL region on chromosome 3, 173 variants were identified having a −log10(p) greater than the −log10(p) from haplotype association in the region of the QTL peak (Figure 5E). Of the variants meeting these criteria, the most abundantly represented strain distribution pattern was 129 discordant from all other founder strains (Figure 5F). In total, 7 unique genes were represented among the variants identified by merge analysis. Guanylate binding protein 2b (Gbp2b) is a priority candidate QTG based on meeting all three criteria: human orthologue, liver expression, and biological relevance.
Figure 5.

(A) Genome scan plot illustrating QTL associated with the module 7 eigengene values. Dashed horizontal line indicates permutation-based genome wide significance at the 0.1 level. (B) Founder strain probabilities at the locus peak. The x-axis plots paired animals in order from left to right by increasing log(module 7 eigengene values). Each horizontal row indicates the probability of a given Collaborative Cross founder haplotype being present at the locus, with darker intensities indicating higher probabilities (0–1.0). (C) Estimates and confidence intervals for haplotype substitution effects at the peak locus. (D) Confidence interval plot for the QTL on chromosome 3. The 80% confidence interval is indicated by gray shading. (E) Comparison of −log10(p) values from 8-allele haplotype model (line) to −log10(p) values from 2-allele merge analysis (dots) for variants in the 80% confidence interval with a −log10(p) from merge analysis merge analysis > −log10(p) from 8-allele haplotype model and a −log10(p) from merge analysis >6. (F) Corresponding strain distribution pattern for variants represented in E. Each track corresponds to strain distribution pattern indicated in the left margin by a string of integers representing the alleles for the eight founder strains, in the order: A/J, B6, 129, NOD, NZO, CAST, PWK, and WSB. Within each SDP track, the vertical lines indicate the locations of the variants within the strain distribution pattern.
The QTL associated with the ME9 eigengene gene values is on chromosome 12 (Figure 6A). Founder probabilities at the QTL peak show an overrepresentation of NOD and NZO DNA among the mice with the lowest ME9 eigengene values (Figure 6B). Bayesian modeling of the QTL haplotype effects correspondingly estimated a strong negative effect of the NOD and NZO haplotypes on ME9 eigengene values (Figure 6C). The ME9 eigengene value QTL was mapped to an 80% confidence interval of 36.32–45.11 Mb (Figure 6D). Merge analysis was used to identify QTGs in the region that may explain the differences in ME9 eigengene values as previously described (Mosedale et al., 2019; Mosedale et al., 2017). In the ME9 eigengene value QTL region on chromosome 12, 192 variants were identified having a merge analysis −log10(p) greater than the −log10(p) from haplotype association at the QTL peak (Figure 6E). Of the variants meeting these criteria, the most abundantly represented strain distribution pattern was NOD and CAST discordant from all other founder strains (Figure 6F). In total, 7 unique genes were represented among the variants identified by merge analysis. IMP2 inner mitochondrial membrane peptidase-like (Immp2l) is a priority candidate QTG based on meeting all three criteria: human orthologue, liver expression, and biological relevance.
Figure 6.

(A) Genome scan plot illustrating QTL associated with the module 9 eigengene values. Dashed horizontal line indicates permutation-based genome wide significance at the 0.1 level. (B) Founder strain probabilities at the locus peak. The x-axis plots paired animals in order from left to right by increasing log (module 9 eigengene values). Each horizontal row indicates the probability of a given Collaborative Cross founder haplotype being present at the locus, with darker intensities indicating higher probabilities (0–1.0). (C) Estimates and confidence intervals for haplotype substitution effects at the peak locus. (D) Confidence interval plot for the QTL on chromosome 12. The 80% confidence interval is indicated by gray shading. (E) Comparison of −log10(p) values from 8-allele haplotype model (line) to −log10(p) values from 2-allele merge analysis (dots) for variants in the 80% confidence interval with a −log10(p) from merge analysis merge analysis > −log10(p) from 8-allele haplotype model and a −log10(p) from merge analysis >4. (F) Corresponding strain distribution pattern for variants represented in E. Each track corresponds to strain distribution pattern indicated in the left margin by a string of integers representing the alleles for the eight founder strains, in the order: A/J, B6, 129, NOD, NZO, CAST, PWK, and WSB. Within each SDP track, the vertical lines indicate the locations of the variants within the strain distribution pattern.
4. Discussion
As expected, the single dose of TAK-875 used here was not sufficient to result in overt liver injury in CC mice as indicated by the lack of histological change and limited effect on plasma biomarkers of hepatotoxicity. This suggests that the treatment regimen was appropriate to facilitate investigation of early liver events that may precipitate IDILI prior to overt toxicity and/or adaptation. However, it should be noted that the dose used resulted in ~10-fold clinical plasma Cmax, which may explain the clinical findings (dehydration, hunched posture, lethargy, and hypothermia) observed in some animals. While it is possible systemic effects may confound the liver response, there were no statistically significant differences in any of the plasma biomarkers of liver injury among TAK-875 treated animals with and without relevant clinical findings suggesting that systemic and liver effects are not related. Furthermore, there was no statistically significant difference in plasma drug concentration among TAK-875 treated animals with and without relevant clinical findings suggesting that systemic effects are related to genetic sensitivity rather than exposure. Importantly the higher plasma concentrations achieved in CC mice likely helped to attain more clinically relevant concentrations of the TAK-875 acyl glucuronide metabolite (TAK-875-AG), which is thought to contribute to TAK-875 hepatotoxicity but is generated less efficiently in rodents than in humans (Ackerson et al., 2019; Otieno et al., 2017).
Plasma TBA level measured at 6-h post dose was the only biomarker significantly altered in response to TAK-875 treatment as determined by q-value<0.05 and |FC|>1.2. Interestingly fold change values of interim plasma TBA were significantly correlated with fold change in terminal plasma ALT (Pearson correlation, r=0.2440, p<0.0016). This suggests that alterations in bile acid homeostasis may contribute to early TAK-875-induced cellular stress in the CC mice and is in line with previous studies suggesting that alterations in bile acid homeostasis may contribute to TAK-875-induced liver injury in animals (Doerfler et al., 2021; Li et al., 2015; Wolenski et al., 2017) and humans (Longo et al., 2019; Otieno et al., 2017). As in these studies, we also observed that TBA levels were significantly correlated with plasma levels of TAK-875 (Pearson correlation, r=0.5368, p<0.0001), suggesting that bile-acid-mediated hepatotoxicity may be influenced by TAK-875 exposure. A relationship between TAK-875 exposure and hepatotoxicity has also been reported in subjects from the TAK-875 clinical trials (Kaku et al., 2016), but no significant QTLs were identified for TAK-875 plasma concentrations measured in this study despite the strong heritability observed for this trait. We also performed genetic mapping on the plasma biomarkers of liver injury after correction for TAK-875 exposure, but again no significant QTLs were identified for even the traits exhibiting a high degree of GxT heritability. Heritability may result from a genetic architecture that is highly polygenic. We therefore focused on the use of liver gene expression data to inform additional mechanisms of TAK-875 induced hepatocellular stress and to identify novel molecular phenotypes that could be used to perform genetic mapping for toxicity susceptibility.
Gene expression data was analyzed to distinguish TAK-875 treatment effects that occur broadly across the population from those that are heritable and may therefore be indicative of genetic susceptibility. Pathways reflecting an effect on cholesterol metabolism were the most significantly enriched among genes significantly associated with TAK-875 treatment independent of strain and likely reflect responses to the pharmacological action of the drug (Horton et al., 2002). However, analysis of treatment-associated genes that were upregulated and downregulated separately also revealed alterations in immune signaling and bile acid homeostasis pathways. The observation of an altered immune response is in line with the current thinking that hepatocyte stress ultimately leads to the activation of an innate immune response, which is essential for triggering an adaptive immune attack and overt liver injury observed in the clinic (Mosedale and Watkins, 2017). However, the genes downregulated in this study were largely class II molecules of the mouse major histocompatibility complex (MHC or H2 in mice) and acute phase response genes. This is counterintuitive given the proposed role of MHC molecules in antigen presentation in the adaptive immune attack associated with IDILI (Mosedale and Watkins, 2017) and opposite of the observation of increased acute phase response genes in another study of TAK-875-treated mice that were not observed in response to other similar drugs in the same class (Urano et al., 2018). Nevertheless, it is indicative of the potential for broader effects on the immune system. And as noted previously, several studies have reported the ability of TAK-875 to inhibit bile acid transport, which was associated with ALT elevations in dogs (Wolenski et al., 2017) and an important contributor to simulated ALT elevations in humans (Longo et al., 2019). Downregulation of genes in the FXR/RXR activation pathway, which contains many of the key genes involved in bile acid metabolism such as Cyp7a1 and 8b1, is consistent with elevated bile acid levels in the liver of CC mice. The less toxic bile acid profile of rodents (Schadt et al., 2016) and the length of time required for elevated bile acids to induce necrosis (Yang et al., 2014), may explain why this effect did not translate to overt liver injury in the CC mice.
More importantly, we observed significant enrichment of oxidative stress and mitochondrial dysfunction pathways among genes where the TAK-875 induced treatment effect was highly heritable. This analysis likely reflects mechanisms that are only activated in individuals that are susceptible to TAK-875 DILI. The contribution of oxidative stress and mitochondrial dysfunction to TAK-875-induced liver injury has been suggested by several previous studies using in vivo, in vitro, and in silico approaches (Ackerson et al., 2019; Longo et al., 2019; Otieno et al., 2017; Urano et al., 2018; Wolenski et al., 2017). For example, Otieno et al. (2017) and Ackerson et al. (2019) both describe covalent binding and glutathione depletion in response to the TAK-875-AG metabolite. Otieno et al. (2017) and Longo et al. (2019) also demonstrated the ability of TAK-875 to inhibit mitochondrial respiration in hepatocytes, which was important for eliciting simulated ALT elevations in a quantitative systems toxicology model of TAK-875-induced liver injury (Longo et al., 2019). Interestingly, enrichment of these pathways was observed among variants associated with toxicity susceptibility in a recent genetic analyses of DILI patients (Koido et al., 2020).
Gene expression profiling data were then used for genome-wide eQTL mapping to identify additional “molecular phenotypes” as well as variants influencing their response. The single-transcript approach has been used successfully in CC mice to identify new candidate risk factor genes for tolvaptan-induced liver injury (Mosedale et al., 2017). Similar to Mosedale et al. (2017), we identified numerous eQTLs using baseline and TAK-875 expression data and most variants strongly associated with gene expression levels tended to lie near the corresponding genes in both groups. However, more directly relevant for identifying variants that influence treatment-induced responses were the 3 GxT eQTLs identified using the fold change in expression between strain pairs of vehicle- and TAK-875-treated mice. Of these genes, Txn1, was considered a priority transcript based on its biological relevance to liver injury. Txn1 is an antioxidant protein that helps to regulate apoptosis, and increased levels of Txn1 are associated with resistance to drug-induced liver injury (Lee et al., 2018). Interestingly, Koido et al. (2020) reported an enrichment of the oxidant-induced survival pathway among gene variants associated with DILI due to multiple different drugs which subsequently showed significant overlap with an analysis performed using TAK-875 patient data. Fold change in Txn1 was associated with a peak on chromosome 4, but no priority candidate QTGs were identified among associated variants.
Lastly, we used gene pathways derived from WGCNA for eQTL mapping similar to Keller et al. (2018) but leveraging treatment-induced transcript changes to evaluate GxT effects. Two significant eQTLs were identified using the eigengene values for empirically determined WGCNA gene modules. ME7 was enriched with transcripts representing macrophage activation and immune signaling pathways and ME9 contained transcripts representing mitochondrial dysfunction and oxidative stress. This finding also corroborates previous TAK-875 mechanistic studies (Ackerson et al., 2019; Longo et al., 2019; Otieno et al., 2017; Urano et al., 2018; Wolenski et al., 2017) and suggests these modules may reflect the relative activation of such pathways across CC lines. Gbp2b was identified as priority candidate QTG within the ME7 QTL. Gbp2b is an interferon-inducible protein that plays a role in the maturation of dendritic cells and activation of the inflammasome (Meunier et al., 2015). Immp2l was identified as priority candidate QTG within the ME9 QTL. Immp2l is a mitochondrial protein necessary for the catalytic activity of the mitochondrial inner membrane peptidase complex (Bharadwaj et al., 2014). Mitochondrial activity pathway genes were also enriched among variants associated with DILI due to multiple different drugs and TAK-875 in the studies of Koido et al. (2020). In the CC strains, variants in both Gbp2b and Immp2l are associated with changes across all genes in their respective modules. It would be interesting to perform targeted resequencing of these genes as well as TXN1 in DNA from human DILI cases. This may further inform the mechanism of TAK-875 DILI well as identify additional variants predictive of general DILI risk.
5. Conclusion
In conclusion, overt hepatotoxicity was not observed in response to a single 600 mg/kg dose of TAK-875 in CC mice. Treatment-induced gene expression changes occurring independently of genetic background reflect alterations in immune response and bile acid homeostasis pathways. Whereas, treatment-induced gene expression changes that were highly heritable reflect enrichment of mitochondrial dysfunction and oxidative stress pathways, which are in line with results from previous mechanistic studies of TAK-875 toxicity. A pathway-based approach to mapping with fold-change expression data also identified genetic risk factors for TAK-875 DILI at the level of the hepatocyte, as previously identified in DILI patients. Taken together, our results support the hypothesis that a gene pathway-based approach using Collaborative Cross mice could inform sensitive strains, human-relevant mechanisms of toxicity, and genetic risk factors for TAK-875 DILI. This novel preclinical approach may be helpful in understanding, predicting, and ultimately preventing clinical DILI for other drugs.
Supplementary Material
Acknowledgements
This work was supported by funding received from Takeda Pharmaceuticals International, Inc. WV and YC were supported by a National Institute of General Medical Sciences grant R35-GM127000. We would like to thank Darla Miller and the team of the UNC System Genetic Core for their assistance with the Collaborative Cross mice. We would like to thank Carol Bobbit and Linda Pluta of the former Hamner Institutes for Health Sciences for their technical guidance and support of these studies. We would also like to thank Martin Paton of Takeda for support of the analytical work.
References
- Ackerson T, Amberg A, Atzrodt J, Arabeyre C, Defossa E, Dorau M, Dudda A, Dwyer J, Holla W, Kissner T, et al. (2019). Mechanistic Investigations of the Liver Toxicity of the Free Fatty Acid Receptor 1 Agonist Fasiglifam (Tak875) and Its Primary Metabolites. Journal of biochemical and molecular toxicology 33, e22345. [DOI] [PubMed] [Google Scholar]
- Bates D, Mächler M, Bolker B, and Walker S (2015). Fitting Linear Mixed-Effects Models Using Lme4. Journal of Statistical Software 67, 1–48. [Google Scholar]
- Benjamini Y, and Hochberg Y (1995). Controlling the False Discovery Rate: A Practical and Powerful Approach to Multiple Testing. Journal of the Royal Statistical Society 57, 289–300. [Google Scholar]
- Bharadwaj MS, Zhou Y, Molina AJ, Criswell T, and Lu B (2014). Examination of Bioenergetic Function in the Inner Mitochondrial Membrane Peptidase 2-Like (Immp2l) Mutant Mice. Redox biology 2, 1008–1015. [DOI] [PMC free article] [PubMed] [Google Scholar]
- Burkholder T, Foltz C, Karlsson E, Linton CG, and Smith JM (2012). Health Evaluation of Experimental Laboratory Mice. Current protocols in mouse biology 2, 145–165. [DOI] [PMC free article] [PubMed] [Google Scholar]
- Chiu WA, and Rusyn I (2018). Advancing Chemical Risk Assessment Decision-Making with Population Variability Data: Challenges and Opportunities. Mamm Genome 29, 182–189. [DOI] [PMC free article] [PubMed] [Google Scholar]
- Church RJ, Wu H, Mosedale M, Sumner SJ, Pathmasiri W, Kurtz CL, Pletcher MT, Eaddy JS, Pandher K, Singer M, et al. (2014). A Systems Biology Approach Utilizing a Mouse Diversity Panel Identifies Genetic Differences Influencing Isoniazid-Induced Microvesicular Steatosis. Toxicol Sci 140, 481–492. [DOI] [PMC free article] [PubMed] [Google Scholar]
- Collaborative_Cross_Consortium (2012). The Genome Architecture of the Collaborative Cross Mouse Genetic Reference Population. Genetics 190, 389–401. [DOI] [PMC free article] [PubMed] [Google Scholar]
- Doerfler H, Botesteanu D-A, Blech S, and Laux R (2021). Untargeted Metabolomic Analysis Combined with Multivariate Statistics Reveal Distinct Metabolic Changes in Gpr40 Agonist-Treated Animals Related to Bile Acid Metabolism. Frontiers in Molecular Biosciences 7. [DOI] [PMC free article] [PubMed] [Google Scholar]
- Dudbridge F, and Koeleman BPC (2004). Efficient Computation of Significance Levels for Multiple Associations in Large Studies of Correlated Data, Including Genomewide Association Studies. The American Journal of Human Genetics 75, 424–435. [DOI] [PMC free article] [PubMed] [Google Scholar]
- Fitzmaurice GM, Lipsitz SR, and Ibrahim JG (2007). A Note on Permutation Tests for Variance Components in Multilevel Generalized Linear Mixed Models. Biometrics 63, 942–946. [DOI] [PubMed] [Google Scholar]
- Fu C-P, Welsh CE, Villena F.P.-M.d., and McMillan L (2012). Inferring Ancestry in Admixed Populations Using Microarray Probe Intensities. In Proceedings of the ACM Conference on Bioinformatics, Computational Biology and Biomedicine (Orlando, Florida: ACM; ), pp. 105–112. [Google Scholar]
- Harrill AH, DeSmet KD, Wolf KK, Bridges AS, Eaddy JS, Kurtz CL, Hall JE, Paine MF, Tidwell RR, and Watkins PB (2012). A Mouse Diversity Panel Approach Reveals the Potential for Clinical Kidney Injury Due to Db289 Not Predicted by Classical Rodent Models. Toxicol Sci 130, 416–426. [DOI] [PMC free article] [PubMed] [Google Scholar]
- Harrill AH, and McAllister KA (2017). New Rodent Population Models May Inform Human Health Risk Assessment and Identification of Genetic Susceptibility to Environmental Exposures. Environ Health Perspect 125, 086002. [DOI] [PMC free article] [PubMed] [Google Scholar]
- Harrill AH, Watkins PB, Su S, Ross PK, Harbourt DE, Stylianou IM, Boorman GA, Russo MW, Sackler RS, Harris SC, et al. (2009). Mouse Population-Guided Resequencing Reveals That Variants in Cd44 Contribute to Acetaminophen-Induced Liver Injury in Humans. Genome Res 19, 1507–1515. [DOI] [PMC free article] [PubMed] [Google Scholar]
- Horton JD, Goldstein JL, and Brown MS (2002). Srebps: Activators of the Complete Program of Cholesterol and Fatty Acid Synthesis in the Liver. The Journal of clinical investigation 109, 1125–1131. [DOI] [PMC free article] [PubMed] [Google Scholar]
- Huang da W, Sherman BT, and Lempicki RA (2009a). Bioinformatics Enrichment Tools: Paths toward the Comprehensive Functional Analysis of Large Gene Lists. Nucleic Acids Res 37, 1–13. [DOI] [PMC free article] [PubMed] [Google Scholar]
- Huang da W, Sherman BT, and Lempicki RA (2009b). Systematic and Integrative Analysis of Large Gene Lists Using David Bioinformatics Resources. Nature protocols 4, 44–57. [DOI] [PubMed] [Google Scholar]
- Irizarry RA, Hobbs B, Collin F, Beazer-Barclay YD, Antonellis KJ, Scherf U, and Speed TP (2003). Exploration, Normalization, and Summaries of High Density Oligonucleotide Array Probe Level Data. Biostatistics 4, 249–264. [DOI] [PubMed] [Google Scholar]
- Kaku K, Enya K, Nakaya R, Ohira T, and Matsuno R (2016). Long-Term Safety and Efficacy of Fasiglifam (Tak-875), a G-Protein-Coupled Receptor 40 Agonist, as Monotherapy and Combination Therapy in Japanese Patients with Type 2 Diabetes: A 52-Week Open-Label Phase Iii Study. Diabetes, Obesity and Metabolism 18, 925–929. [DOI] [PubMed] [Google Scholar]
- Keane TM, Goodstadt L, Danecek P, White MA, Wong K, Yalcin B, Heger A, Agam A, Slater G, Goodson M, et al. (2011). Mouse Genomic Variation and Its Effect on Phenotypes and Gene Regulation. Nature 477, 289–294. [DOI] [PMC free article] [PubMed] [Google Scholar]
- Keele GR, Crouse WL, Kelada SNP, and Valdar W (2019). Determinants of Qtl Mapping Power in the Realized Collaborative Cross. G3 9, 1707–1727. [DOI] [PMC free article] [PubMed] [Google Scholar]
- Keller MP, Gatti DM, Schueler KL, Rabaglia ME, Stapleton DS, Simecek P, Vincent M, Allen S, Broman AT, Bacher R, et al. (2018). Genetic Drivers of Pancreatic Islet Function. Genetics 209, 335–356. [DOI] [PMC free article] [PubMed] [Google Scholar]
- Koido M, Kawakami E, Fukumura J, Noguchi Y, Ohori M, Nio Y, Nicoletti P, Aithal GP, Daly AK, Watkins PB, et al. (2020). Polygenic Architecture Informs Potential Vulnerability to Drug-Induced Liver Injury. Nat Med 26, 1541–1548. [DOI] [PMC free article] [PubMed] [Google Scholar]
- Laifenfeld D, Qiu L, Swiss R, Park J, Macoritto M, Will Y, Younis HS, and Lawton M (2014). Utilization of Causal Reasoning of Hepatic Gene Expression in Rats to Identify Molecular Pathways of Idiosyncratic Drug-Induced Liver Injury. Toxicol Sci 137, 234–248. [DOI] [PubMed] [Google Scholar]
- Lee BW, Jeon BS, and Yoon BI (2018). Exogenous Recombinant Human Thioredoxin-1 Prevents Acetaminophen-Induced Liver Injury by Scavenging Oxidative Stressors, Restoring the Thioredoxin-1 System and Inhibiting Receptor Interacting Protein-3 Overexpression. J Appl Toxicol 38, 1008–1017. [DOI] [PubMed] [Google Scholar]
- Leone A, Nie A, Brandon Parker J, Sawant S, Piechta L-A, Kelley MF, Mark Kao L, Jim Proctor S, Verheyen G, Johnson MD, et al. (2014). Oxidative Stress/Reactive Metabolite Gene Expression Signature in Rat Liver Detects Idiosyncratic Hepatotoxicants. Toxicology and Applied Pharmacology 275, 189–197. [DOI] [PubMed] [Google Scholar]
- Li X, Zhong K, Guo Z, Zhong D, and Chen X (2015). Fasiglifam (Tak-875) Inhibits Hepatobiliary Transporters: A Possible Factor Contributing to Fasiglifam-Induced Liver Injury. Drug Metab Dispos 43, 1751–1759. [DOI] [PubMed] [Google Scholar]
- Longo DM, Woodhead JL, Walker P, Heredi-Szabo K, Mogyorosi K, Wolenski FS, Dragan YP, Mosedale M, Siler SQ, Watkins PB, et al. (2019). Quantitative Systems Toxicology Analysis of in Vitro Mechanistic Assays Reveals Importance of Bile Acid Accumulation and Mitochondrial Dysfunction in Tak-875-Induced Liver Injury. Toxicol Sci 167, 458–467. [DOI] [PMC free article] [PubMed] [Google Scholar]
- Marcinak JF, Munsaka MS, Watkins PB, Ohira T, and Smith N (2018). Liver Safety of Fasiglifam (Tak-875) in Patients with Type 2 Diabetes: Review of the Global Clinical Trial Experience. Drug Saf 41, 1431–1437. [DOI] [PubMed] [Google Scholar]
- Meunier E, Wallet P, Dreier RF, Costanzo S, Anton L, Ruhl S, Dussurgey S, Dick MS, Kistner A, Rigard M, et al. (2015). Guanylate-Binding Proteins Promote Activation of the Aim2 Inflammasome During Infection with Francisella Novicida. Nat Immunol 16, 476–484. [DOI] [PMC free article] [PubMed] [Google Scholar]
- Monroe JJ, Tanis KQ, Podtelezhnikov AA, Nguyen T, Machotka SV, Lynch D, Evers R, Palamanda J, Miller RR, Pippert T, et al. (2020). Application of a Rat Liver Drug Bioactivation Transcriptional Response Assay Early in Drug Development That Informs Chemically Reactive Metabolite Formation and Potential for Drug-Induced Liver Injury. Toxicological sciences : an official journal of the Society of Toxicology 177, 281–299. [DOI] [PMC free article] [PubMed] [Google Scholar]
- Morgan AP, and Welsh CE (2015). Informatics Resources for the Collaborative Cross and Related Mouse Populations. Mammalian Genome 26, 521–539. [DOI] [PMC free article] [PubMed] [Google Scholar]
- Mosedale M (2018). Mouse Population-Based Approaches to Investigate Adverse Drug Reactions. Drug Metab Dispos 46, 1787–1795. [DOI] [PubMed] [Google Scholar]
- Mosedale M, Cai Y, Eaddy JS, Corty RW, Nautiyal M, Watkins PB, and Valdar W (2019). Identification of Candidate Risk Factor Genes for Human Idelalisib Toxicity Using a Collaborative Cross Approach. Toxicol Sci 172, 265–278. [DOI] [PMC free article] [PubMed] [Google Scholar]
- Mosedale M, Kim Y, Brock WJ, Roth SE, Wiltshire T, Eaddy JS, Keele GR, Corty RW, Xie Y, Valdar W, et al. (2017). Candidate Risk Factors and Mechanisms for Tolvaptan-Induced Liver Injury Are Identified Using a Collaborative Cross Approach. Toxicol Sci 156, 438–454. [DOI] [PMC free article] [PubMed] [Google Scholar]
- Mosedale M, and Watkins PB (2017). Drug-Induced Liver Injury: Advances in Mechanistic Understanding That Will Inform Risk Management. Clinical pharmacology and therapeutics 101, 469–480. [DOI] [PMC free article] [PubMed] [Google Scholar]
- Mosedale M, and Watkins PB (2020). Understanding Idiosyncratic Toxicity: Lessons Learned from Drug-Induced Liver Injury. J Med Chem 63, 6436–6461. [DOI] [PubMed] [Google Scholar]
- Mosedale M, Wu H, Kurtz CL, Schmidt SP, Adkins K, and Harrill AH (2014). Dysregulation of Protein Degradation Pathways May Mediate the Liver Injury and Phospholipidosis Associated with a Cationic Amphiphilic Antibiotic Drug. Toxicol Appl Pharmacol 280, 21–29. [DOI] [PubMed] [Google Scholar]
- Naik H, Vakilynejad M, Wu J, Viswanathan P, Dote N, Higuchi T, and Leifke E (2012). Safety, Tolerability, Pharmacokinetics, and Pharmacodynamic Properties of the Gpr40 Agonist Tak-875: Results from a Double-Blind, Placebo-Controlled Single Oral Dose Rising Study in Healthy Volunteers. The Journal of Clinical Pharmacology 52, 1007–1016. [DOI] [PubMed] [Google Scholar]
- Oreper D, Cai Y, Tarantino LM, de Villena FP-M, and Valdar W (2017). Inbred Strain Variant Database (Isvdb): A Repository for Probabilistically Informed Sequence Differences among the Collaborative Cross Strains and Their Founders. G3 7, 1623–1630. [DOI] [PMC free article] [PubMed] [Google Scholar]
- Otieno MA, Snoeys J, Lam W, Ghosh A, Player MR, Pocai A, Salter R, Simic D, Skaggs H, Singh B, et al. (2017). Fasiglifam (Tak-875): Mechanistic Investigation and Retrospective Identification of Hazards for Drug Induced Liver Injury (Dili). Toxicol Sci 163, 374–384. [DOI] [PubMed] [Google Scholar]
- Phillippi J, Xie Y, Miller DR, Bell TA, Zhang Z, Lenarcic AB, Aylor DL, Krovi SH, Threadgill DW, Pardo-Manuel de Villena F, et al. (2014). Using the Emerging Collaborative Cross to Probe the Immune System. Genes Immun 15, 38–46. [DOI] [PMC free article] [PubMed] [Google Scholar]
- Podtelezhnikov AA, Monroe JJ, Aslamkhan AG, Pearson K, Qin C, Tamburino AM, Loboda AP, Glaab WE, Sistare FD, and Tanis KQ (2020). Quantitative Transcriptional Biomarkers of Xenobiotic Receptor Activation in Rat Liver for the Early Assessment of Drug Safety Liabilities. Toxicol Sci 175, 98–112. [DOI] [PubMed] [Google Scholar]
- Poitou C, Perret C, Mathieu F, Truong V, Blum Y, Durand H, Alili R, Chelghoum N, Pelloux V, Aron-Wisnewsky J, et al. (2015). Bariatric Surgery Induces Disruption in Inflammatory Signaling Pathways Mediated by Immune Cells in Adipose Tissue: A Rna-Seq Study. PLoS One 10, e0125718. [DOI] [PMC free article] [PubMed] [Google Scholar]
- Saul MC, Philip VM, Reinholdt LG, and Chesler EJ (2019). High-Diversity Mouse Populations for Complex Traits. Trends in genetics : TIG 35, 501–514. [DOI] [PMC free article] [PubMed] [Google Scholar]
- Schadt HS, Wolf A, Pognan F, Chibout S-D, Merz M, and Kullak-Ublick GA (2016). Bile Acids in Drug Induced Liver Injury: Key Players and Surrogate Markers. Clinics and Research in Hepatology and Gastroenterology 40, 257–266. [DOI] [PubMed] [Google Scholar]
- Shannon CP, Chen V, Takhar M, Hollander Z, Balshaw R, McManus BM, Tebbutt SJ, Sin DD, and Ng RT (2016). Sabre: A Method for Assessing the Stability of Gene Modules in Complex Tissues and Subject Populations. BMC Bioinformatics 17, 460. [DOI] [PMC free article] [PubMed] [Google Scholar]
- Srivastava A, Morgan AP, Najarian ML, Sarsani VK, Sigmon JS, Shorter JR, Kashfeen A, McMullan RC, Williams LH, Giusti-Rodríguez P, et al. (2017). Genomes of the Mouse Collaborative Cross. Genetics 206, 537–556. [DOI] [PMC free article] [PubMed] [Google Scholar]
- Urano Y, Oda S, Tsuneyama K, and Yokoi T (2018). Comparative Hepatic Transcriptome Analyses Revealed Possible Pathogenic Mechanisms of Fasiglifam (Tak-875)-Induced Acute Liver Injury in Mice. Chem Biol Interact 296, 185–197. [DOI] [PubMed] [Google Scholar]
- Valdar W, Flint J, and Mott R (2006). Simulating the Collaborative Cross: Power of Quantitative Trait Loci Detection and Mapping Resolution in Large Sets of Recombinant Inbred Strains of Mice. Genetics 172, 1783–1797. [DOI] [PMC free article] [PubMed] [Google Scholar]
- Vered K, Durrant C, Mott R, and Iraqi FA (2014). Susceptibility to Klebsiella Pneumonaie Infection in Collaborative Cross Mice Is a Complex Trait Controlled by at Least Three Loci Acting at Different Time Points. BMC Genomics 15, 865. [DOI] [PMC free article] [PubMed] [Google Scholar]
- Visscher PM, Thompson R, and Haley CS (1996). Confidence Intervals in Qtl Mapping by Bootstrapping. Genetics 143, 1013–1020. [DOI] [PMC free article] [PubMed] [Google Scholar]
- Wolenski FS, Zhu AZ, Johnson M, Yu S, Moriya Y, Ebihara T, Csizmadia V, Grieves J, Paton M, Liao M, et al. (2017). Fasiglifam (Tak-875) Alters Bile Acid Homeostasis in Rats and Dogs: A Potential Cause of Drug Induced Liver Injury. Toxicol Sci 157, 50–61. [DOI] [PMC free article] [PubMed] [Google Scholar]
- Woods LCS, Holl KL, Oreper D, Xie Y, Tsaih S-W, and Valdar W (2012). Fine-Mapping Diabetes-Related Traits, Including Insulin Resistance, in Heterogeneous Stock Rats. Physiological genomics 44, 1013–1026. [DOI] [PMC free article] [PubMed] [Google Scholar]
- Yalcin B, Flint J, and Mott R (2005). Using Progenitor Strain Information to Identify Quantitative Trait Nucleotides in Outbred Mice. Genetics 171, 673–681. [DOI] [PMC free article] [PubMed] [Google Scholar]
- Yang K, Woodhead JL, Watkins PB, Howell BA, and Brouwer KL (2014). Systems Pharmacology Modeling Predicts Delayed Presentation and Species Differences in Bile Acid-Mediated Troglitazone Hepatotoxicity. Clin Pharmacol Ther 96, 589–598. [DOI] [PMC free article] [PubMed] [Google Scholar]
- Zhang B, and Horvath S (2005). A General Framework for Weighted Gene Co-Expression Network Analysis. Statistical applications in genetics and molecular biology 4, Article17. [DOI] [PubMed] [Google Scholar]
- Zhang Z, Wang W, and Valdar W (2014). Bayesian Modeling of Haplotype Effects in Multiparent Populations. Genetics 198, 139–156. [DOI] [PMC free article] [PubMed] [Google Scholar]
Associated Data
This section collects any data citations, data availability statements, or supplementary materials included in this article.