FIGURE 2.

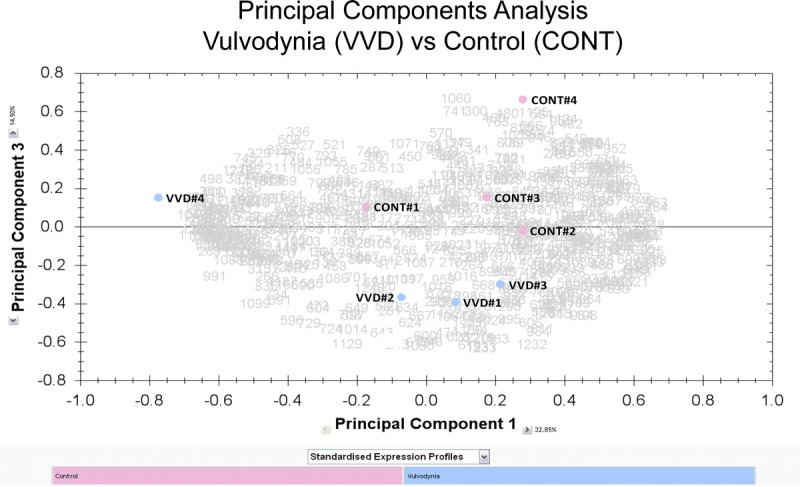
Principal component analysis. Values for the normalized volumes for all of the 658 spots in the 2D-DIGE gels were used to perform a principal component analysis of the gel data. The samples are designated CONT #1 to #4 and VVD #1 to #4.

Principal component analysis. Values for the normalized volumes for all of the 658 spots in the 2D-DIGE gels were used to perform a principal component analysis of the gel data. The samples are designated CONT #1 to #4 and VVD #1 to #4.