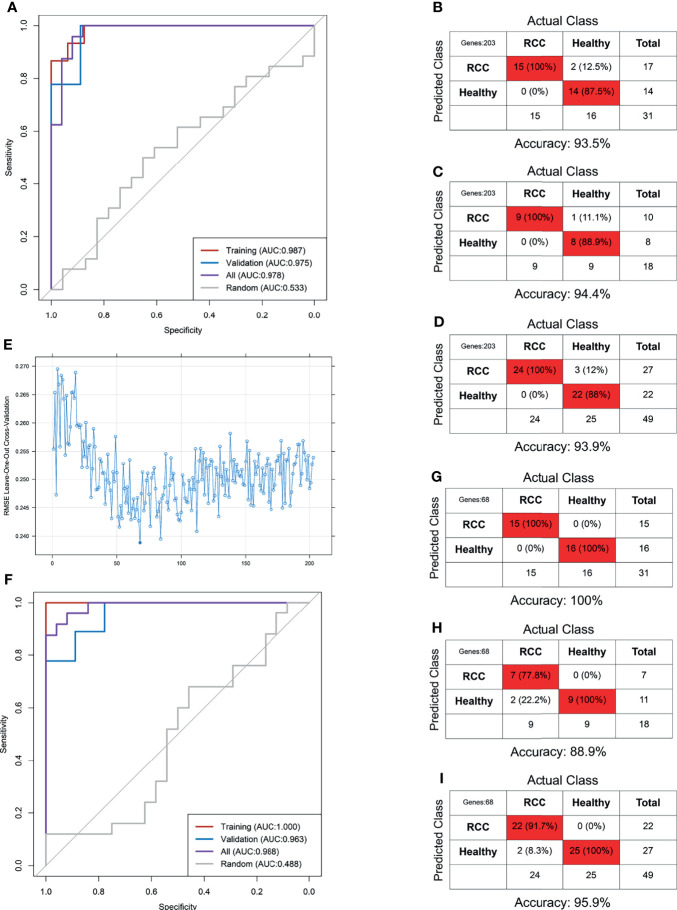
Figure 5.
The RCC-based TEP model for the detection of RCC. The ROC curve (A) and the confounding matrix in the training set (B), validation set (C), and overall cohort (D) of the primary model. The ROC curve (F) and the confounding matrix in the training set (G), validation set (H), and overall cohort (I) of the optimized model after REF selection (E).

