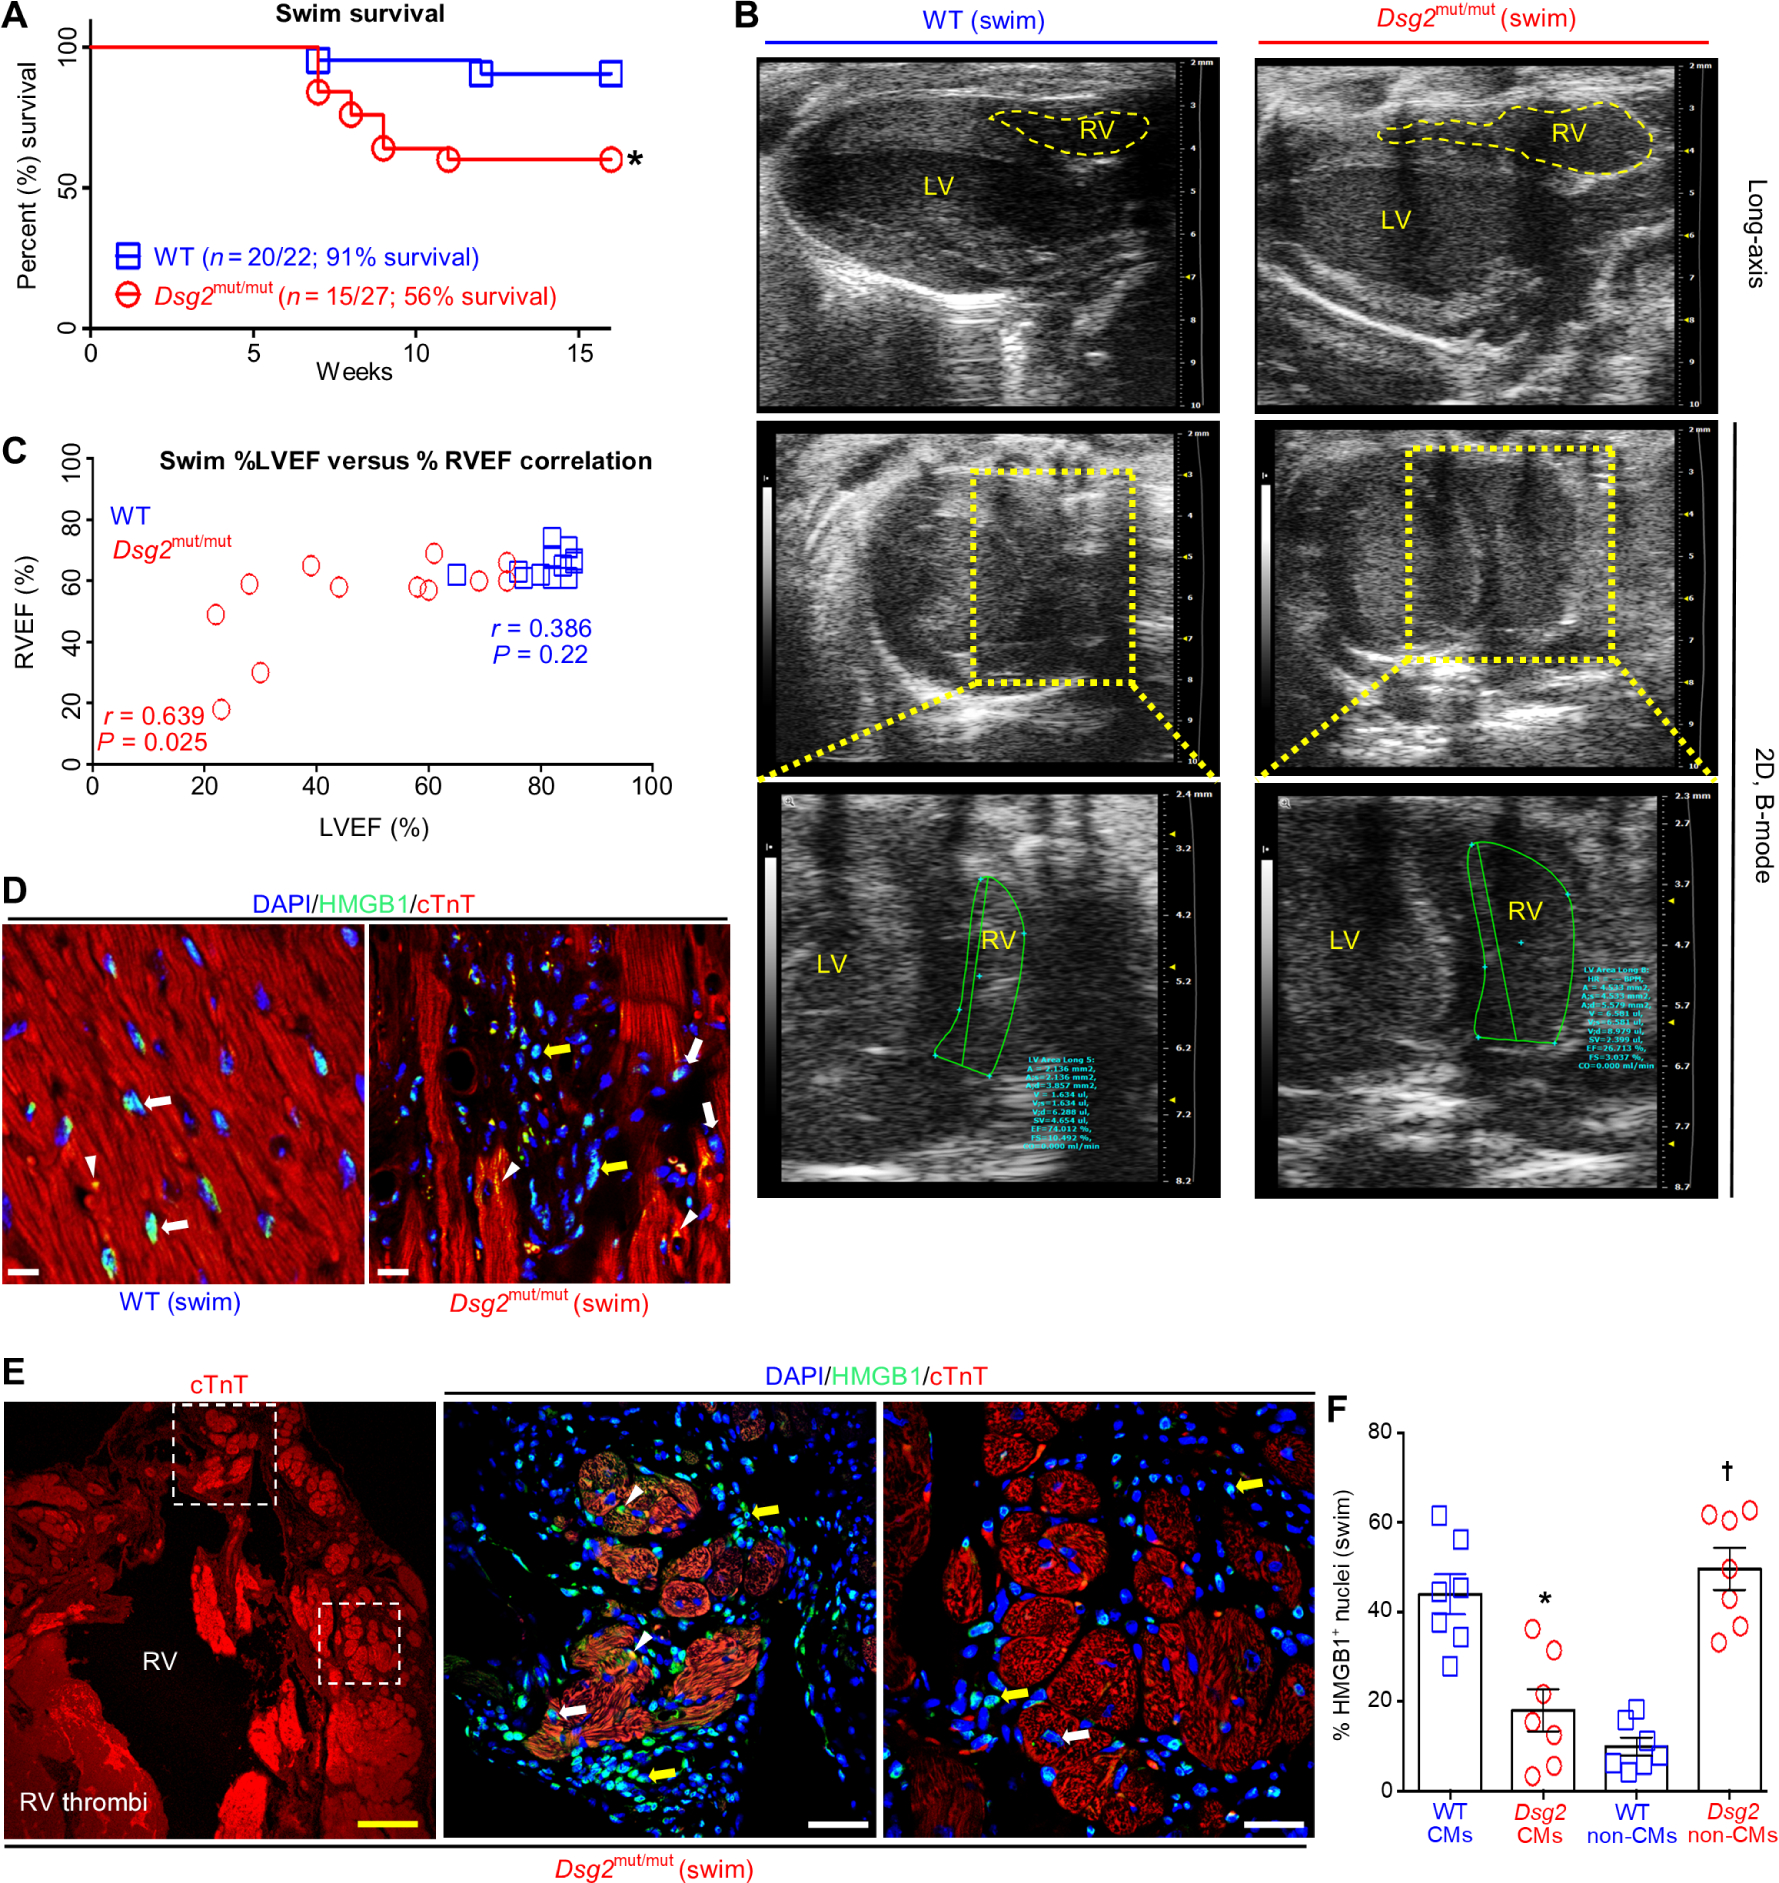
Fig. 1. RV and LV dysfunction and myocardial necrosis in response to endurance exercise in Dsg2mut/mut mice.

(A) Percent survival during swim. *P < 0.05 compared to WT, Mantel-Cox survival analysis. (B) Representative long-axis (top) and two-dimensional (2D), B-mode (bottom two panels) echocardiography from exercised WT and Dsg2mut/mut mice. Data are representative of n ≥ 15 mice per genotype. Yellow-dashed box indicates enlarged image of 2D, B-mode middle. (C) Comparison of the percent RV ejection fraction (%RVEF) with the percent left ventricle ejection fraction (%LVEF) using Pearson’s correlation analysis. P values represent Pearson’s correlation between %RVEF and %LVEF within each genotype (n ≥ 12 mice per genotype per parameter). (D and E) Representative HMGB1 immunostained myocardium from exercised WT and Dsg2mut/mut mice. White arrows, cardiomyocytes (CMs) positive (+) for HMGB1 nuclear localization; yellow arrows, non-CMs with HMGB1+ nuclei; white arrowheads, cytoplasmic HMGB1. In (E), dotted-line white boxes highlight enlarged areas in the right panels with the upper boxed area shown in the first panel to the right and the lower boxed area shown in the second panel to the right. Yellow scale bar in the first panel (E), 100 μm; white scale bars, 20 μm. (F) Quantification of CMs and non-CMs positive for nuclear HMGB1 in myocardium from exercised Dsg2mut/mut and WT mice. Data are presented as means ± SEM (n = 7 mice per genotype per parameter; *P < 0.05 Dsg2mut/mut CMs compared to WT CMs; †P < 0.05 Dsg2mut/mut non-CMs compared to WT non-CMs using paired t test).
