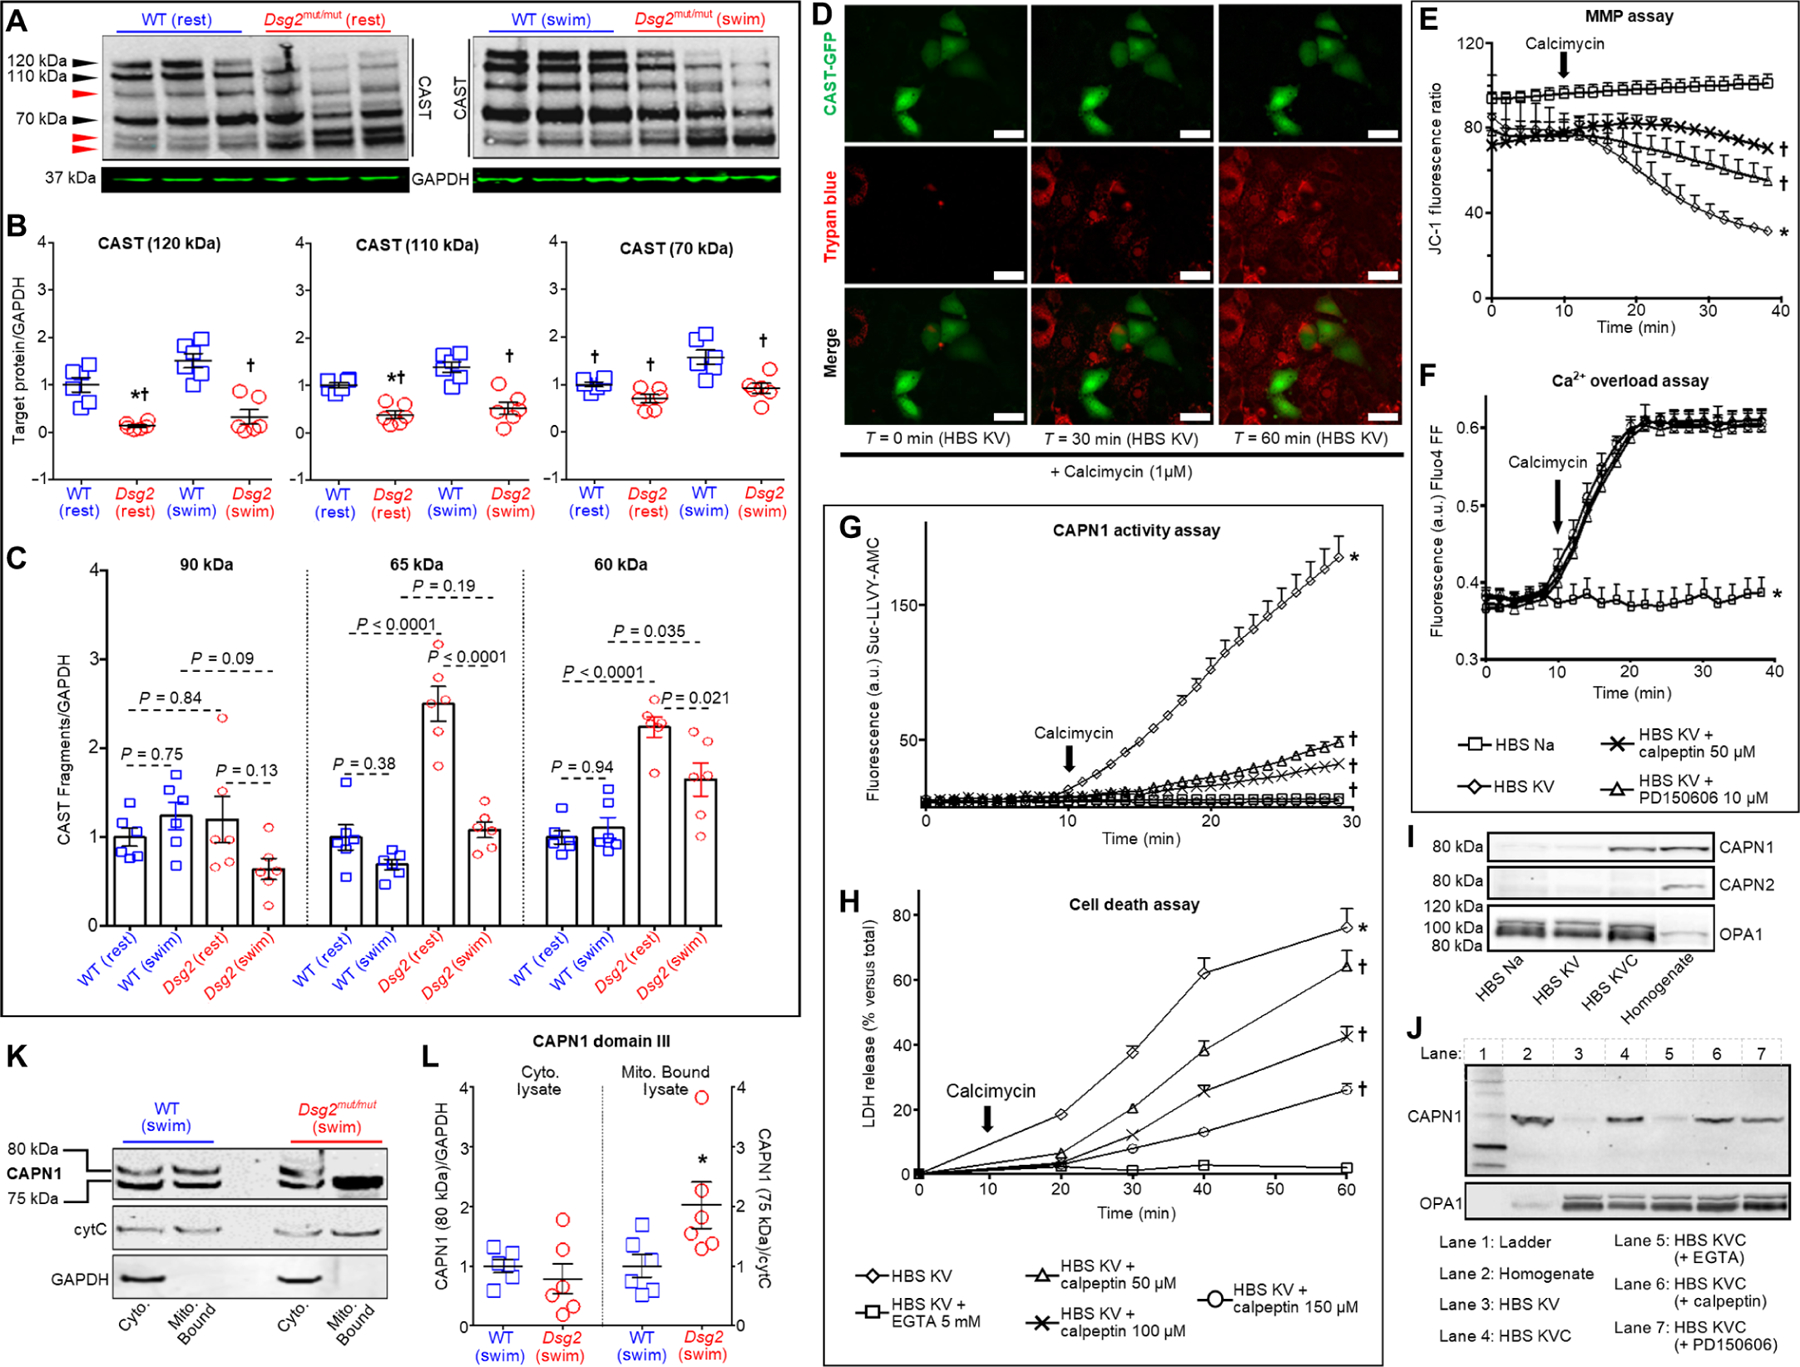
Fig. 3. CAST abundance is reduced in hearts of Dsg2mut/mut mice, and CAST overexpression or CAPN inhibition rescues HL-1 cells from Ca2+ overload–induced cell death.

(A) Representative immunoblots probed for changes in calpastatin (CAST) from sedentary (left, rest) and exercised (right, swim) mice. Black arrowheads, CAST isoforms; red arrowheads, CAST proteolytic fragments. Immunoblots are representative of n = 6 mice per genotype per condition. GAPDH was used as a loading control. (B) Quantification of CAST isoforms in myocardial lysates from sedentary and exercised Dsg2mut/mut and WT mice. Data are presented as means ± SEM [n = 6 mice per genotype per condition; *P < 0.05 Dsg2mut/mut (rest) compared to WT (rest); †P < 0.05 for any group compared to WT (swim) using one-way ANOVA with Tukey’s post hoc test]. (C) Quantification of CAST fragments (90, 65, and 60 kDa) from sedentary and exercised cohorts. Data are presented as mean ± SEM (n = 6 mice per genotype per condition, indicated comparisons determined using one-way ANOVA with Tukey’s post hoc test). (D) Live-cell imaging of HL-1 cells transfected with a CAST-GFP (green) overexpression construct subjected to HBS KV medium in the absence and presence of calcimycin (1 μM), to induce Ca2+ overload. Trypan blue (red) admits red fluorescence via confocal microscopy and is only taken up in dead cells. Of note, HL-1 cells overexpressing CAST (green cells) are protected from Ca2+ overload–induced cell death (absence of red fluorescence in green cells). Images representative of n = 6 independent experiments, with n = 3 replicates per cell culture per condition. In (E) to (J), HL-1 cells were exposed to the conditions indicated in each panel. (E) Mitochondrial membrane potential (MMP) was monitored using the fluorescent ratiometric probe JC-1 (1.5 μM). *P < 0.05 for HBS KV compared to HBS Na; †P < 0.05 for HBS KV with either calpeptin or PD150606 compared to HBS KV using one-way ANOVA. (F) Intracellular calcium was monitored by means of Fluo4 FF fluorescence. *P < 0.05 for HBS Na compared to all other conditions using one-way ANOVA. (G) CAPN1 activity was monitored by proteolysis of the synthetic peptide Suc-LLVY-AMC (25 μM). (H) Cell death was detected as LDH release. In (G) and (H), *P < 0.05 for HBS KV compared to all conditions; †P < 0.05 for HBS KV with calpeptin (50, 100, or 150 μM) compared to HBS KV using one-way ANOVA. For (E) to (H), data are presented as means ± SD, n = 6 independent experiments per cohort, with n = 3 cell culture replicates/condition. (I) Representative immunoblots of CAPN1 or CAPN2 in purified mitochondria from HL-1 cells incubated under the indicated conditions for 2 min. Equal protein loading was indicated by staining with antibodies recognizing the mitochondrial protein OPA1. (J) Representative immunoblots of CAPN1 in purified mitochondria from HL-1 cells subjected to calcium overload (HBS KVC) in the absence or presence of EGTA (5 mM), calpeptin (50 μM), or PD150606 (10 μM). Cells were incubated under the indicated conditions for 2 min. For (I) and (J), immunoblots used CAPN1 antibody that recognizes domain IV and are representative of n = 6 independent experiments per cohort, with n = 3 cell culture replicates per condition. (K and L) Myocardial samples were analyzed from mice of the indicated genotype subjected to the swim protocol. Representative immunoblots of CAPN1 (using an antibody that recognizes domain III) in cytosolic (Cyto.) fractions and mitochondrial fractions (Mito. Bound). GAPDH was used as a loading control for cytosolic lysates; cytochrome C (cytC) was used as a loading control for mitochondria-bound samples. Quantification is shown and statistical differences [*P < 0.05 for 75-kDa CAPN1 Dsg2mut/mut (swim) compared to 75 kDa CAPN1 WT (swim)] were determined using one-way ANOVA.
