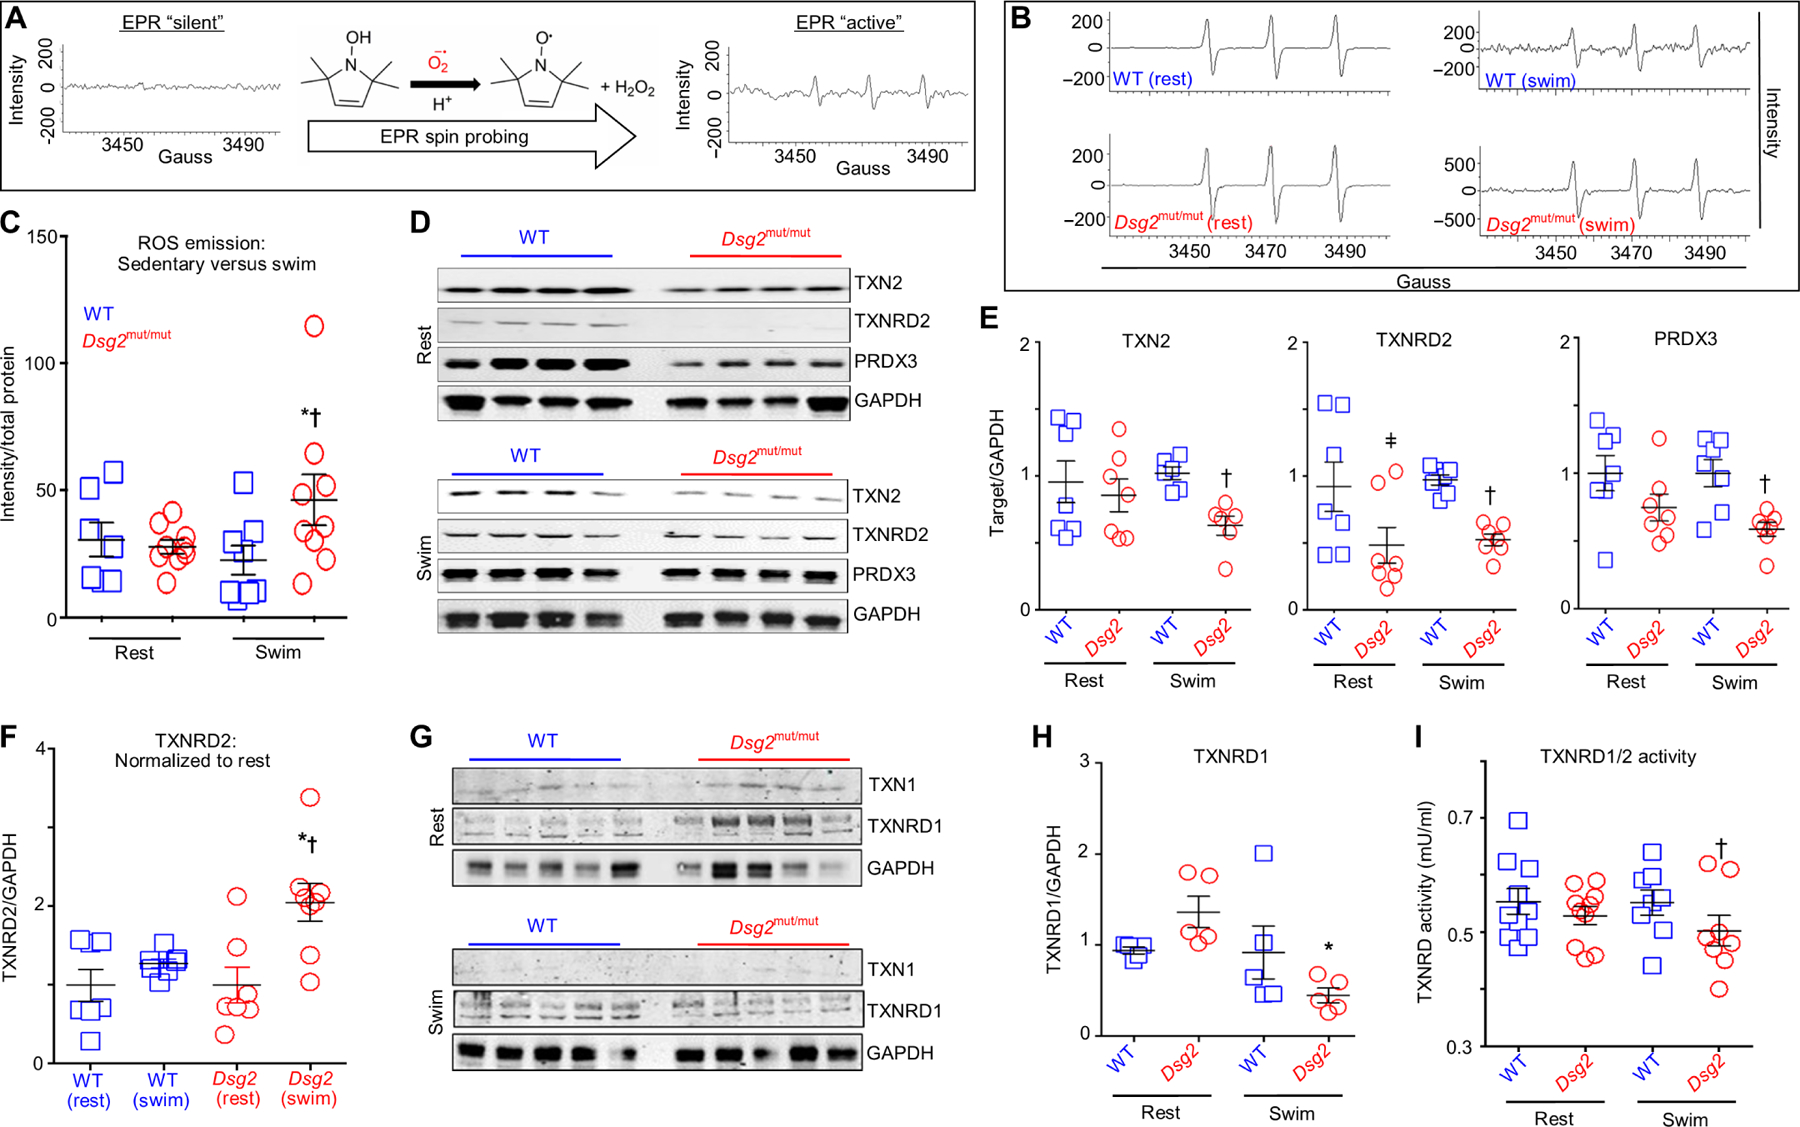
Fig. 6. Exercise fails to up-regulate the mitochondrial TXN2 system in Dsg2mut/mut hearts.

(A) Schematic of ROS emission recordings made with electron paramagnetic resonance (EPR) spectroscopy. (B) Representative EPR tracings from sedentary (rest) and exercised (swim) cohorts. (C) ROS emission in sedentary (rest) and exercised (swim) WT and Dsg2mut/mut mice. Data are presented as means ± SEM [n ≥ 7 genotype per cohort; *P < 0.05 Dsg2mut/mut (swim) compared to Dsg2mut/mut (rest); †P < 0.05 Dsg2mut/mut (swim) compared to WT (swim), using one-way ANOVA]. (D and E) Immunoblots and quantification from sedentary and exercised cohorts probed for thioredoxin-2 (TXN2), TXN2 reductase (TXNRD2), and peroxiredoxin-3 (PRXD3) with GAPDH as the loading control. Quantified data are presented as means ± SEM [n ≥ 6 mice per genotype per parameter; ǂP < 0.05 Dsg2mut/mut (rest) compared to WT (rest); †P < 0.05 Dsg2mut/mut (swim) compared to WT (swim), using one-way ANOVA]. (F) Exercised TXNRD2 levels normalized to sedentary TXNRD2 levels, within genotype. Note the increased TXNRD2 levels from exercised Dsg2mut/mut mice compared to TXNRD2 levels from sedentary Dsg2mut/mut mice. Data presented as means ± SEM, n ≥ 7 genotype per cohort, *P < 0.05 Dsg2mut/mut (swim) versus Dsg2mut/mut (rest); †P < 0.05 Dsg2mut/mut (swim) versus WT (swim) using one-way ANOVA. (G) Western immunoblots from sedentary and exercised cohorts probed for thioredoxin-1 (TXN1) and TXN1-reductase (TXNRD1), normalized to GAPDH. (H) Sedentary Dsg2mut/mut mice showed an increased trend toward elevated TXNRD1 levels, which was markedly down-regulated in response to swimming. Data presented as mean ± SEM, n = 5 genotype per cohort. *P < 0.05 Dsg2mut/mut (swim) versus Dsg2mut/mut (rest) using one-way ANOVA. (I) TXNRD1/2 activity was assessed in myocardial homogenates. Of note, myocardial lysates from exercised Dsg2mut/mut mice showed reduced TXNRD1/2 activity compared to exercised WT mice. Data presented as means ± SEM, n ≥ 8 genotype per cohort, †P < 0.05 Dsg2mut/mut (swim) versus WT (swim) using one-way ANOVA.
