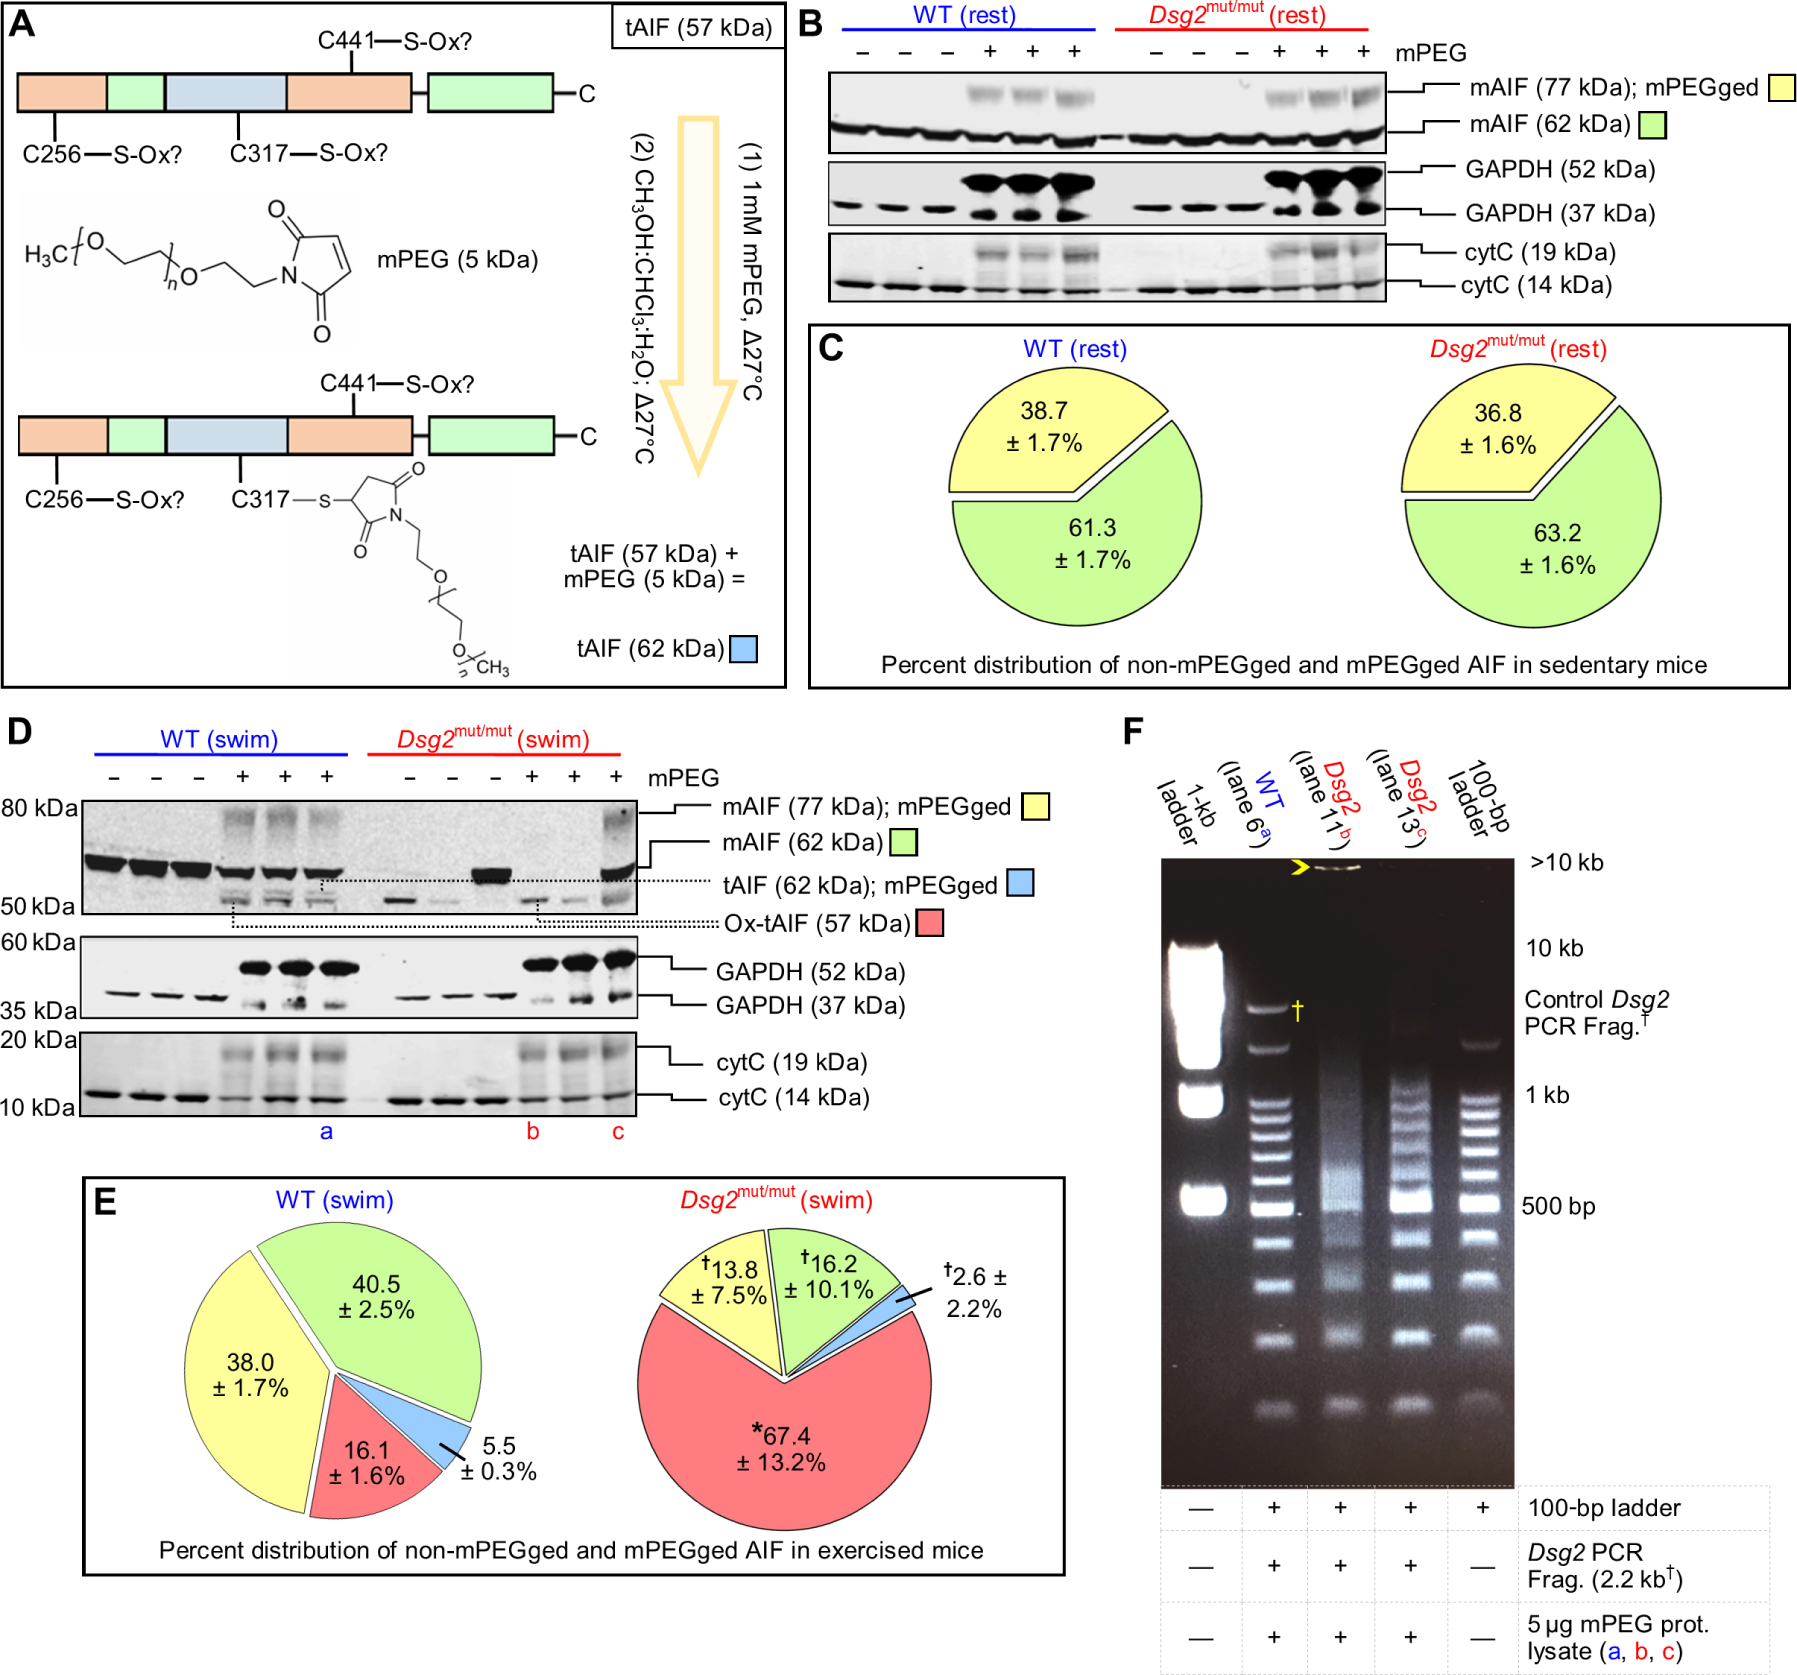
Fig. 7. Exercise promotes AIF-oxidation and DNA fragmentation.

(A) Representative schematic of methoxypolyethylene glycol maleimide (mPEG) modification of AIF. Any nonoxidized cysteine (C256, C317, or C441) binds mPEG, adding 5 kDa to AIF per mPEG-modified cysteine. (B) Representative immunoblots from untreated (−) and mPEG-treated (+) lysates from sedentary (rest) cohorts. (C) Percent (%) distribution of unmodified (non-mPEGged) and mPEG-modified (mPEGged) AIF from sedentary mice. Data are presented as mean ± SEM. No significant differences in the distribution within and between sedentary cohorts were detected by one-way ANOVA (n = 6 per genotype per parameter). (D and E) Representative immunoblots and percent distribution of non-mPEGged and mPEGged mAIF and truncated AIF (tAIF) from exercised (swim) cohorts. Data are presented with means ± SEM [n = 6 WT mice per parameter, n = 7 Dsg2mut/mut mice per parameter; *P < 0.05 for Dsg2mut/mut compared to WT within each respective AIF condition; for example, Dsg2mut/mut mAIF 77-kDa mPEGged (yellow) versus WT mAIF 77-kDa mPEGged (yellow)], using one-way ANOVA with Tukey’s post hoc test. †P < 0.05 for any AIF condition (yellow, green, or blue) compared to ox-tAIF (57 kDa, red) using one-way ANOVA with Tukey’s post hoc test. For (C) and (E), percent distribution was calculated as the amount of each mPEGged or non-mPEGged AIF form divided by the sum of all AIF forms times 100. (F) Representative DNA retardation assay. Five micrograms of mPEG-treated protein lysates [from the samples shown in (D): lane 6 (a), lane 11 (b), and lane 13 (c)] was incubated with a 2.2-kb DNA fragment (†Frag.) generated via polymerase chain reaction (PCR) from the WT form of murine Dsg2 and a 100-bp DNA ladder. Yellow open arrowhead marks most retarded fragment. Data are representative of n ≥ 6 mice per genotype per lane.
