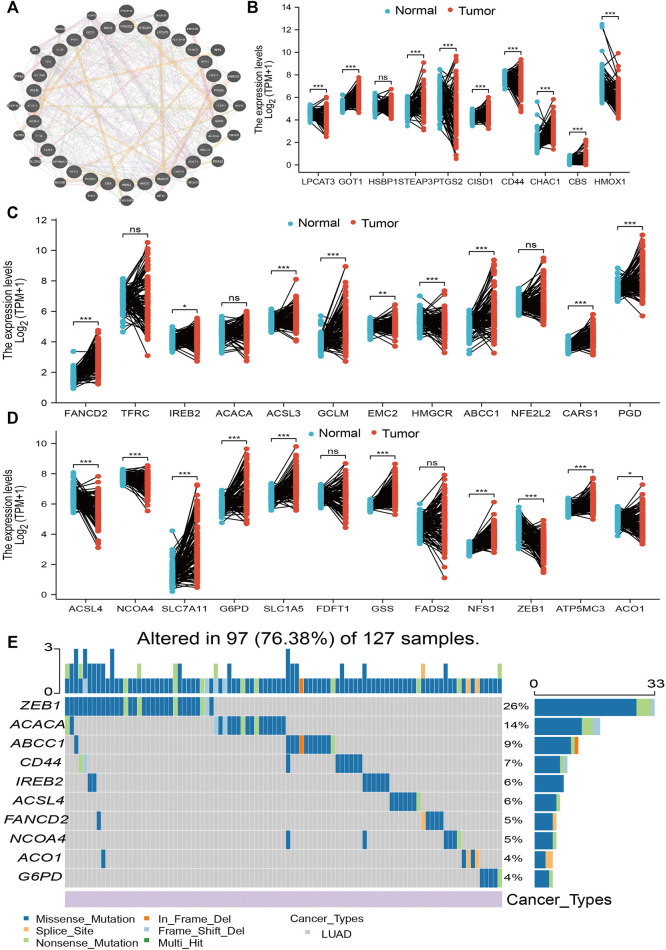
FIGURE 1.
Analysis of the expression and gene mutation of FRGs in LUAD. (A) The gene–gene interaction networks of FRG analysis by the GeneMANIA database. (B–D) The expression of FRGs in LUAD is examined by the TCGA database. (E) The mutation frequency and classification of FRGs in LUAD were examined by GSCA tools. For all figures, ∗, ∗∗, and ∗∗∗ indicate p < 0.05, p < 0.01, and p < 0.001, respectively.

