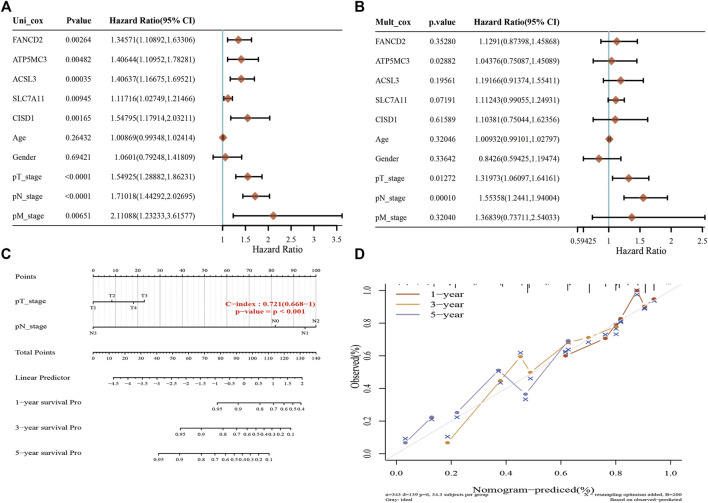
FIGURE 5.
Construction of a predictive nomogram in LUAD. (A,B) Hazard ratio and p‐value of the constituents involved in univariate and multivariate Cox regression considering clinical parameters and six prognostics FRGs in LUAD. (C,D) Nomogram predicts the 1-, 3-, and 5-year overall survival rate of LUAD patients and calibration curve for the overall survival nomogram model in the discovery group. A dashed diagonal line represents the ideal nomogram. *p < 0.05, **p < 0.01, ***p < 0.001.

