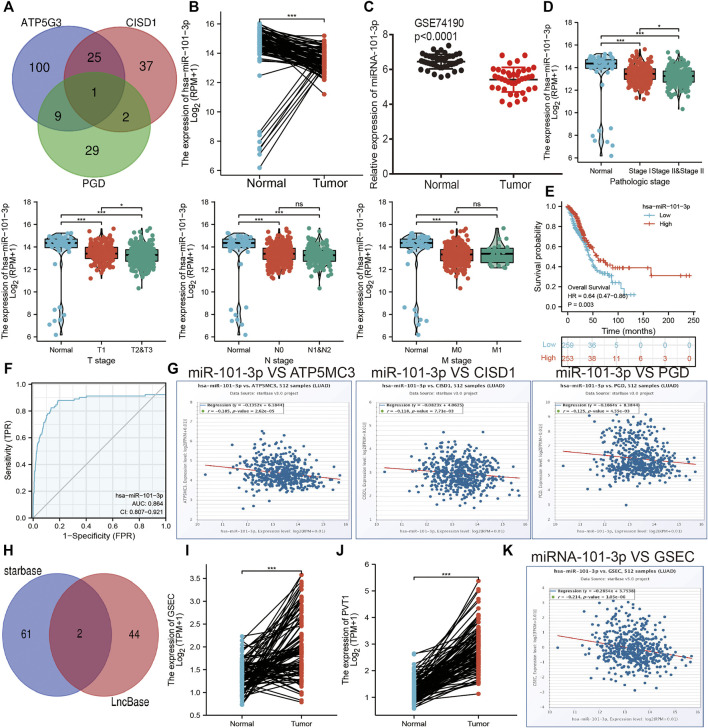
FIGURE 8.
Prediction and analysis of the upstream miRNAs of FRGs in LUAD. (A) Prediction of the potential miRNAs of FRGs in LUAD examined by starbase. (B,C) The expression of miRNA-101-3p in LUAD was examined by TCGA/GEO databases. (D) The correlation between FRGs and clinical features in LUAD. (E) The prognosis value of miRNA-101-3p in LUAD. (F) ROC curve analyses and AUC values for miRNA-101-3p in LUAD. (G) Pearson’s correlation analysis determined the correlation between miRNA-101-3p and ATP5MC3, CISD1, and PGD expression in LUAD examined by starbase. (H) Explored the potential lncRNAs of miRNA-101-3p in LUAD by starbase. (I,J) The expression of GESC and PVT1 in LUAD was examined by starbase. (K) Pearson’s correlation analysis determined the correlation between miRNA-101-3p and GSEC in LUAD. *p < 0.05, **p < 0.01, ***p < 0.001.

