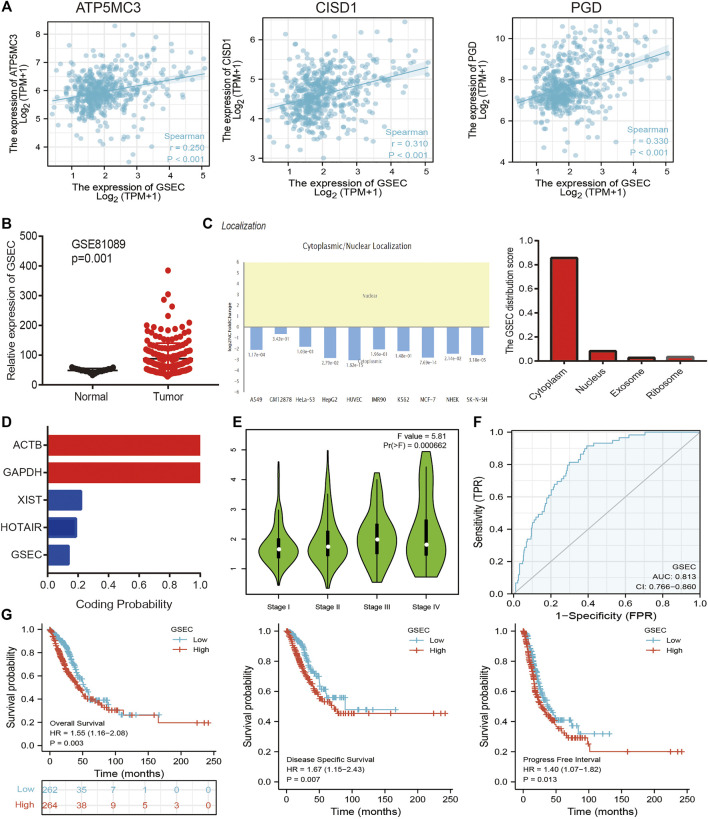
FIGURE 9.
Construction of lncRNA/miRNA/FRG interaction network. (A) Pearson’s correlation analysis determined the correlation between GSEC and ATP5MC3, CISD1, and PGD in LUAD. (B) The expression of GESC in LUAD is examined by the GEO dataset. (C) The subcellular location of GESC is examined by lncLocator and Annolnc2 databases. (D) The coding ability of GESC is examined by coding potential calculator databases. (E) The pathologic stage of GESC in LUAD is examined by GEPIA databases. (F) ROC curve analyses and AUC values for GSEC in LUAD. (G) The prognosis of GESC in LUAD is examined by GEPIA databases. *p < 0.05, **p < 0.01, ***p < 0.001.

