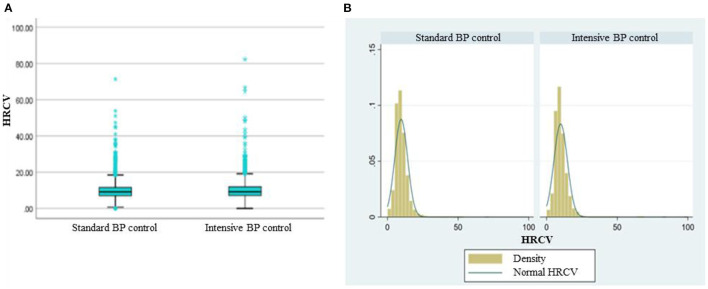
Figure 1.
The distribution of HRCV according to treatment arms. (A) Box plot of HRCV grouped by standard and intensive BP control. No significant difference between the two groups by Mann-whitney U-test (P = 0.052). (B) Density curve of HRCV grouped by standard and intensive BP control. Normal HRCV: normal distribution curve of HRCV.

