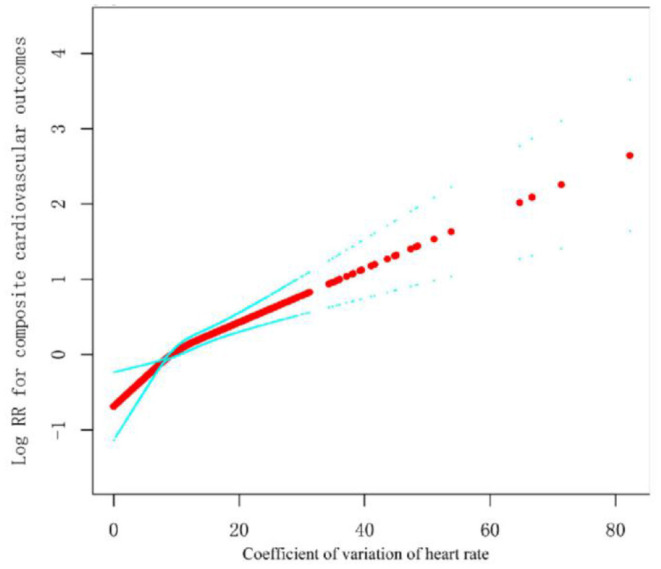
Figure 2.

Smooth spline curves of visit-to-visit heart rate variability for the estimation of risk of composite cardiovascular outcomes. The red dot is Log HR, and the blue dot is 95%CI.All covariables in Model 3 were adjusted.

Smooth spline curves of visit-to-visit heart rate variability for the estimation of risk of composite cardiovascular outcomes. The red dot is Log HR, and the blue dot is 95%CI.All covariables in Model 3 were adjusted.