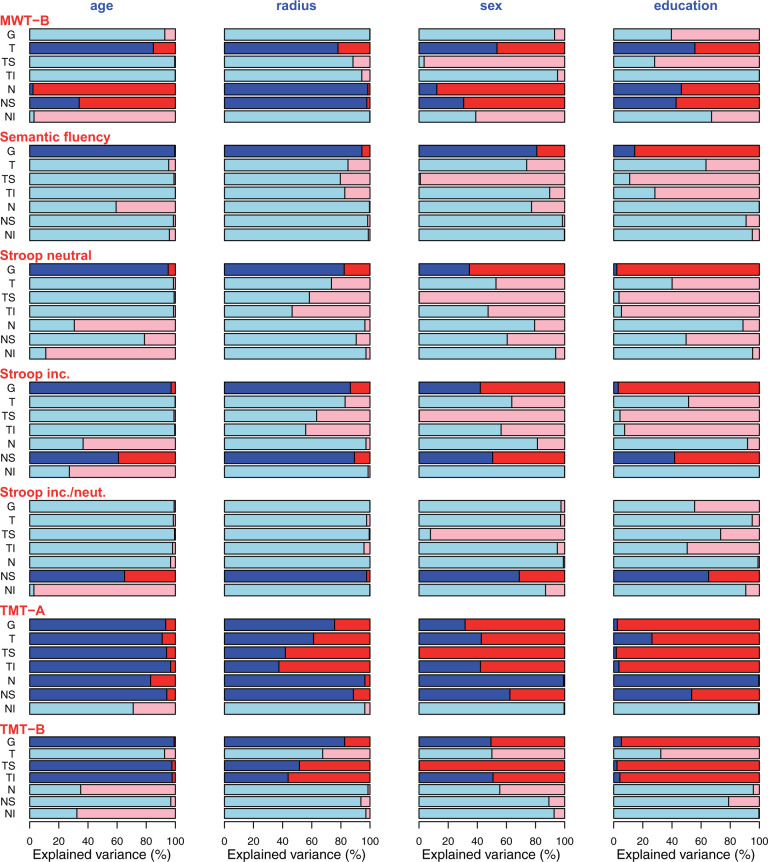
Figure 4.
Ratio of variance sample A. Sample A: Ratio of variance explained by the respective cognitive test score (red) that is not explained by each covariate (blue; from left to right: age, radius, sex, education) relative to the total explained variance. Only tests with significant slopes were included. Segments for which the cognitive test score was not significant after correcting for the covariates are shown in pale colours. In other words, the red part of each bar illustrates the percentage of variance that is explained in addition to the variance that is already explained by age, radius, sex, education, respectively.

