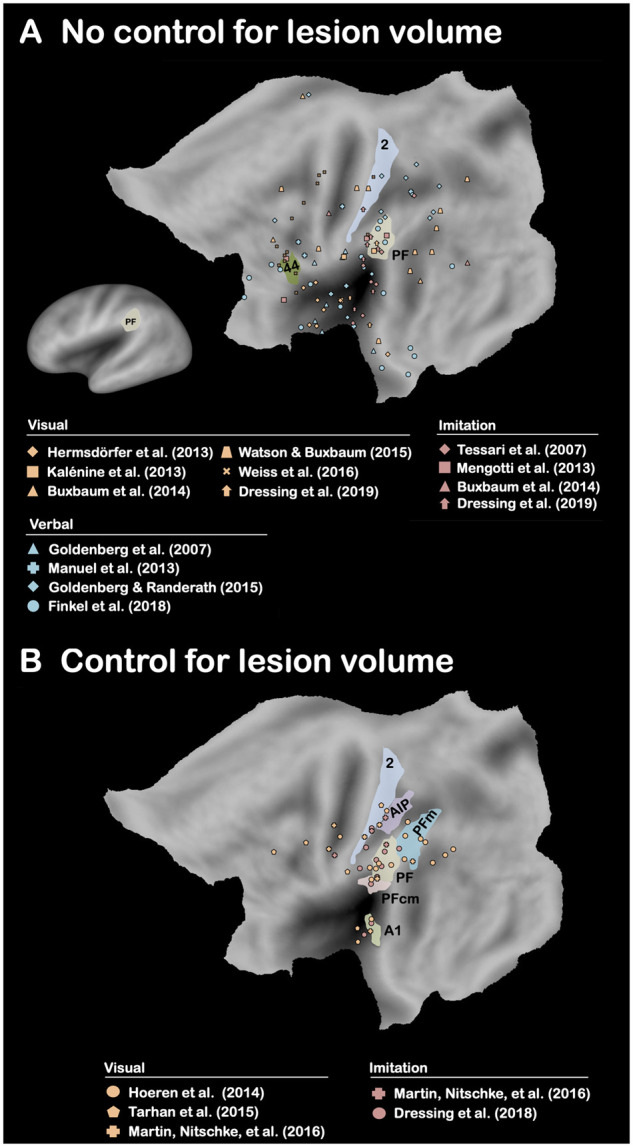
Figure 4.

Brain-lesion studies of pantomime of tool use (No control and Control for lesion volume). Maximum lesion overlap locations are represented on the PALS-B12 left hemisphere (flat maps, main figures; very inflated map, mini figure) atlas surface configuration.249 Brain areas are identified using anatomical labels from the parcellation of Glasser et al.81 (A) Only the brain areas that have been reported in at least 50% of the conditions in which there was no control for lesion volume are represented. (B) Only the brain areas that have been reported in at least 50% of the conditions in which there was a control for lesion volume are represented (see Supplementary Methods).
