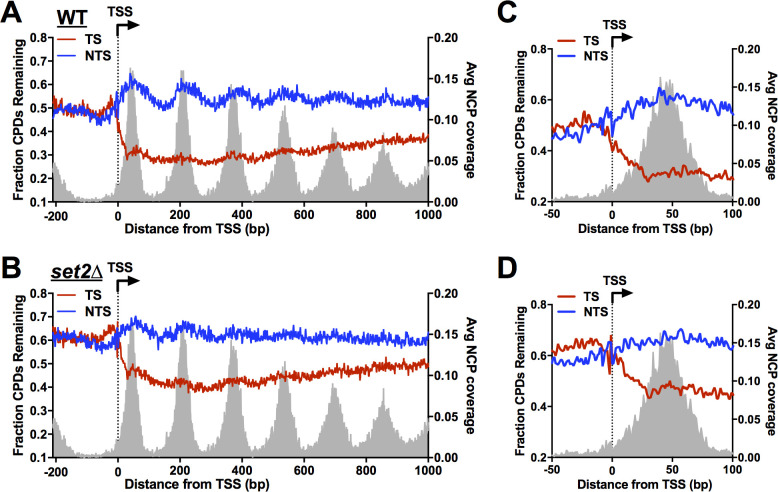
Fig 3. High-resolution CPD-seq analysis of repair around the transcription start site in set2Δ mutant cells.
(A) Single nucleotide resolution analysis of CPD-seq data on both transcribed strand (TS) and nontranscribed strand (NTS) of ~5200 yeast genes around the transcription start site (TSS). The plots depict fraction of unrepaired CPDs following 2hr repair relative to no repair (0hr) for both TS and NTS in WT cells. The data is plotted for each nucleotide positioning spanning -200 bp upstream and +1000 bp downstream of the TSS. CPD-seq data was scaled using the overall repair data for the 2hr time point from alkaline gel analysis (Fig 1G). The positions of nucleosome dyads [77] are shown for reference. (B) Same as panel A, except the data is from set2Δ cells. (C,D) Close-up of CPD-seq data near the TSS within the region of +1 nucleosome in the WT (C) and set2Δ (D) cells. Nucleosome positioning data for the +1 nucleosome is shown for reference.

