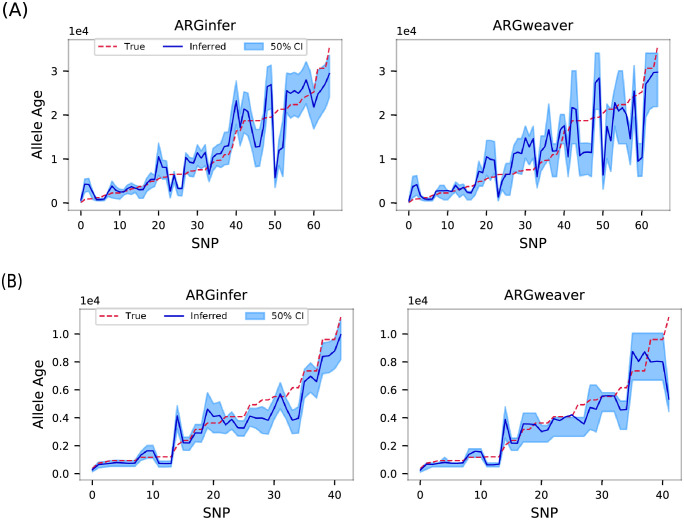
Fig 6. True (red dashed line) allele ages, in units of 104 generations, and posterior mean (blue line) inferred by ARGinfer (left) and ARGweaver (right) for the simulated data sets used in Fig 5.
Along the x axis SNPs are ordered by increasing value of true allele age. (A) R = 1, (B) R = 4, and blue shading shows 50% credible intervals.

