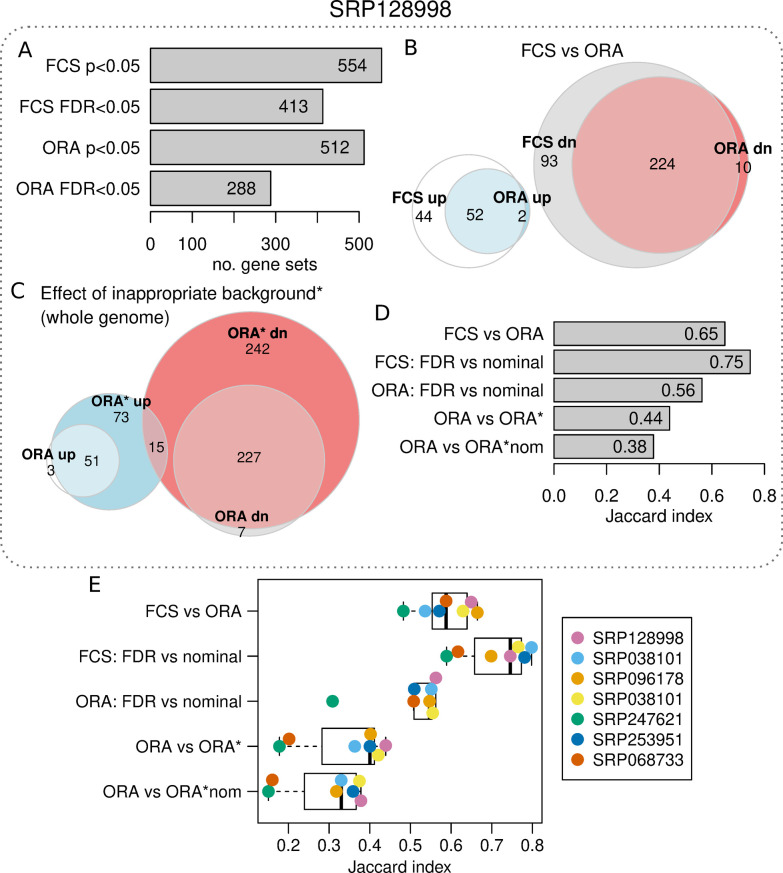
Fig 4. Example enrichment analysis misuse.
(A) Number of differentially expressed gene sets for FCS and ORA methods using nominal p-value and FDR thresholds. (B) Euler diagram showing the overlap of differentially regulated gene sets with FCS and ORA methods (FDR<0.05). (C) Euler diagram shows the overlap of ORA results when using recommended or whole genome background. Whole genome background analysis is indicated with a *. (D) Jaccard index values for enrichment analysis results when conducted in different ways. “FDR” refers to a significance threshold of FDR<0.05. “Nominal” refers to a significance threshold of p<0.05. “ORA*nom” refers to a whole genome background used in tandem with the p<0.05 significance threshold. (E) Jaccard index values for enrichment analysis results when conducted in different ways for seven independent RNA-seq experiments.

