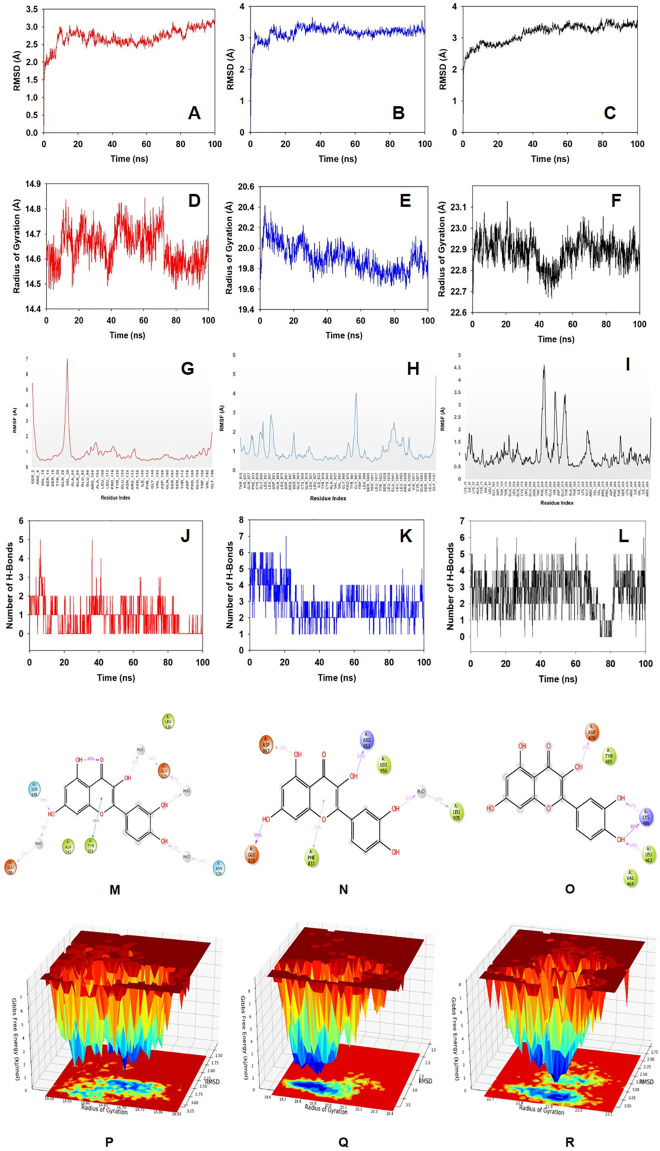
Fig 3. Analysis of MD simulation trajectories for 100 ns.
RMSD plots displaying the molecular vibrations of Cα backbone of (A) BCL-2 (B) JAK2 and (C) Cyp2E1. Radius of gyration plots for the deduction of compactness of protein (D) BCL-2, (E) JAK2 and (F) Cyp2E1. RMSF plots showing the fluctuations of respective amino acids throughout the simulation time 100 ns for (G) BCL-2, (H) JAK2 and (I) Cyp2E1. Number of Hydrogen bonds formed during the course of simulation between quercetin and (J) BCL-2, (K) JAK2 and (L) Cyp2E1. 2D interaction plot of post simulation time between the quercetin and (M) BCL-2 (N) JAK2 and (O) Cyp2E1. Free Energy Landscape displaying the achievement of global minima (ΔG, kj/mol) of (P) BCl-2 (Q) JAK2 and (R) Cyp2E1 in presence of quercetin with respect to their RMSD (Å) and radius of gyration (Rg, Å).

