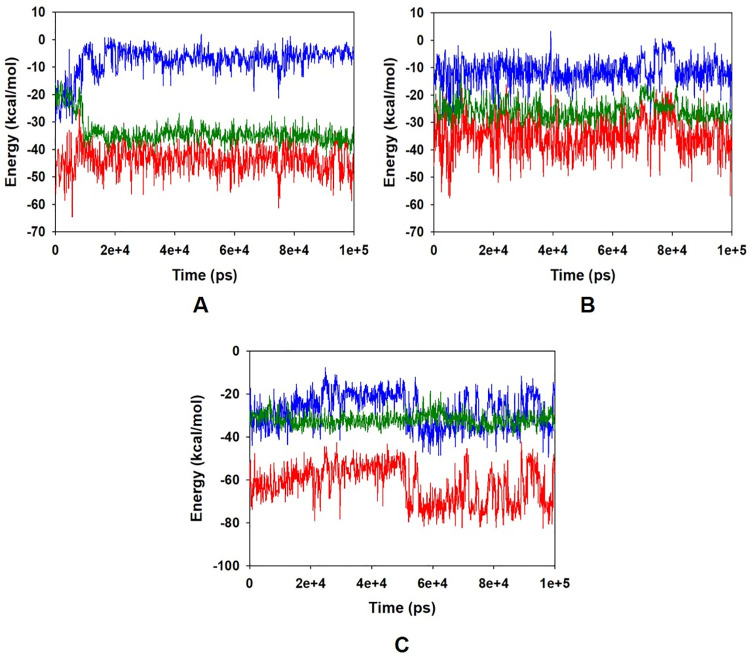
Fig 4.
Energy plot of protein (A) BCL-2 (B) JAK2 and (C) Cyp2E1 and quercetin complex system during the entire simulation event of 100 ns. The total energy (red), van der Waal’s energy (green) and coulomb energy (blue) of the entire system indicating the stability of the individual systems bound to quercetin molecule.

