
Fig. 3.
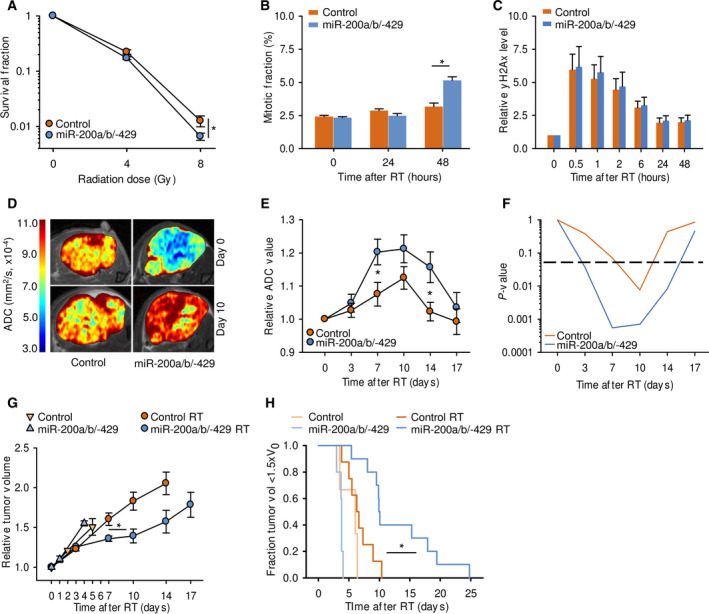
Radiation response of tumor models with stable miR‐200a/b/‐429 overexpression. (A) Clonogenic survival fraction of miRNA‐overexpressing cells and controls after exposure to 4 or 8 Gy, three independent experiments (mean ± SEM; *P < 0.01 from Students T‐test). (B) Mitotic fraction in miRNA‐overexpressing cells and controls after exposure to 8 Gy, four independent experiments (mean ± SEM; *P < 0.05 from Student's T‐test). (C) Relative γH2Ax level of miRNA‐overexpressing cells and controls after exposure to 8 Gy. Median γH2Ax intensity of each sample are presented relative to nonirradiated cells, four independent experiments (mean ± SEM). No significant difference between groups was observed with Student's T‐test. (D) ADC maps of representative tumors before (day 0) and 10 days after exposure to 8 Gy. ADC‐level scale bar is included. (E) ADC in miRNA‐overexpressing tumors (n = 10) and controls (n = 8) after exposure to 8 Gy. Data relative to ADC at day 0 are shown (mean ± SEM; *P < 0.05 from Students T‐test). (F) Significance level (P‐values) of the relative change in ADC from day 0 in miRNA‐overexpressing tumors and in controls based on the data in (E) (one sample Student's T‐test; stapled line, significance level P = 0.05). (G) Tumor volume of miRNA‐overexpressing xenograft tumors (4 nonirradiated, 10 irradiated) and controls (3 nonirradiated, 8 irradiated) after exposure of the irradiated groups to 8 Gy. Data relative to volume at day 0 are shown (mean ± SEM; *P = 0.01 from Student's T‐test on T 1.5×, irradiated miRNA‐overexpressing tumors versus controls). (H) Kaplan–Meier curves of the tumors shown in (G), using fraction of tumors with a volume below 1.5 times the baseline volume (day 0). The Holm–Sidak method was used for all pairwise multiple comparisons (*P < 0.05).